Arc welder

Introduction

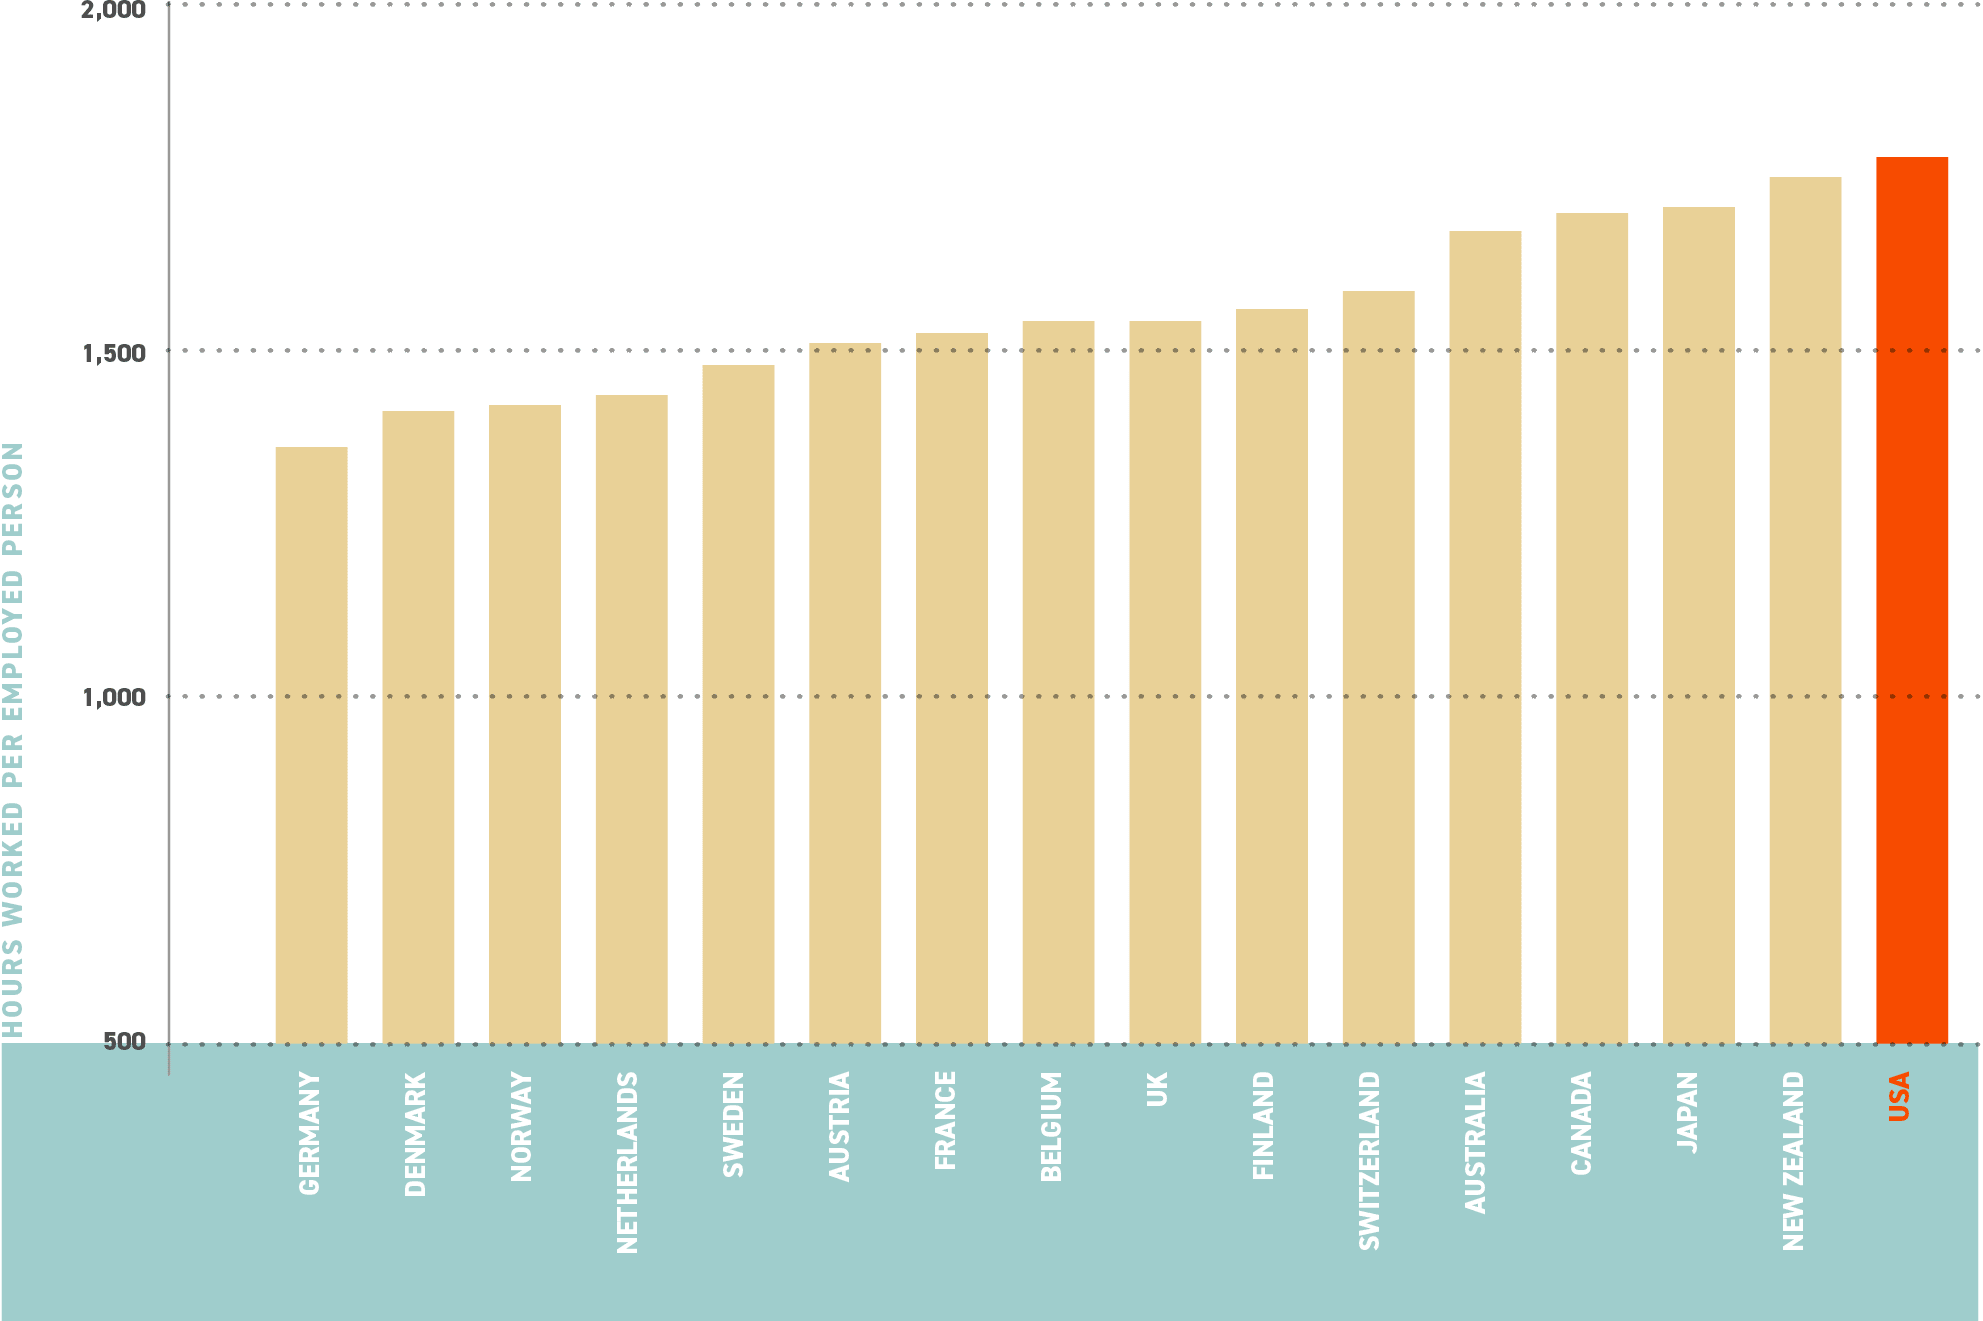
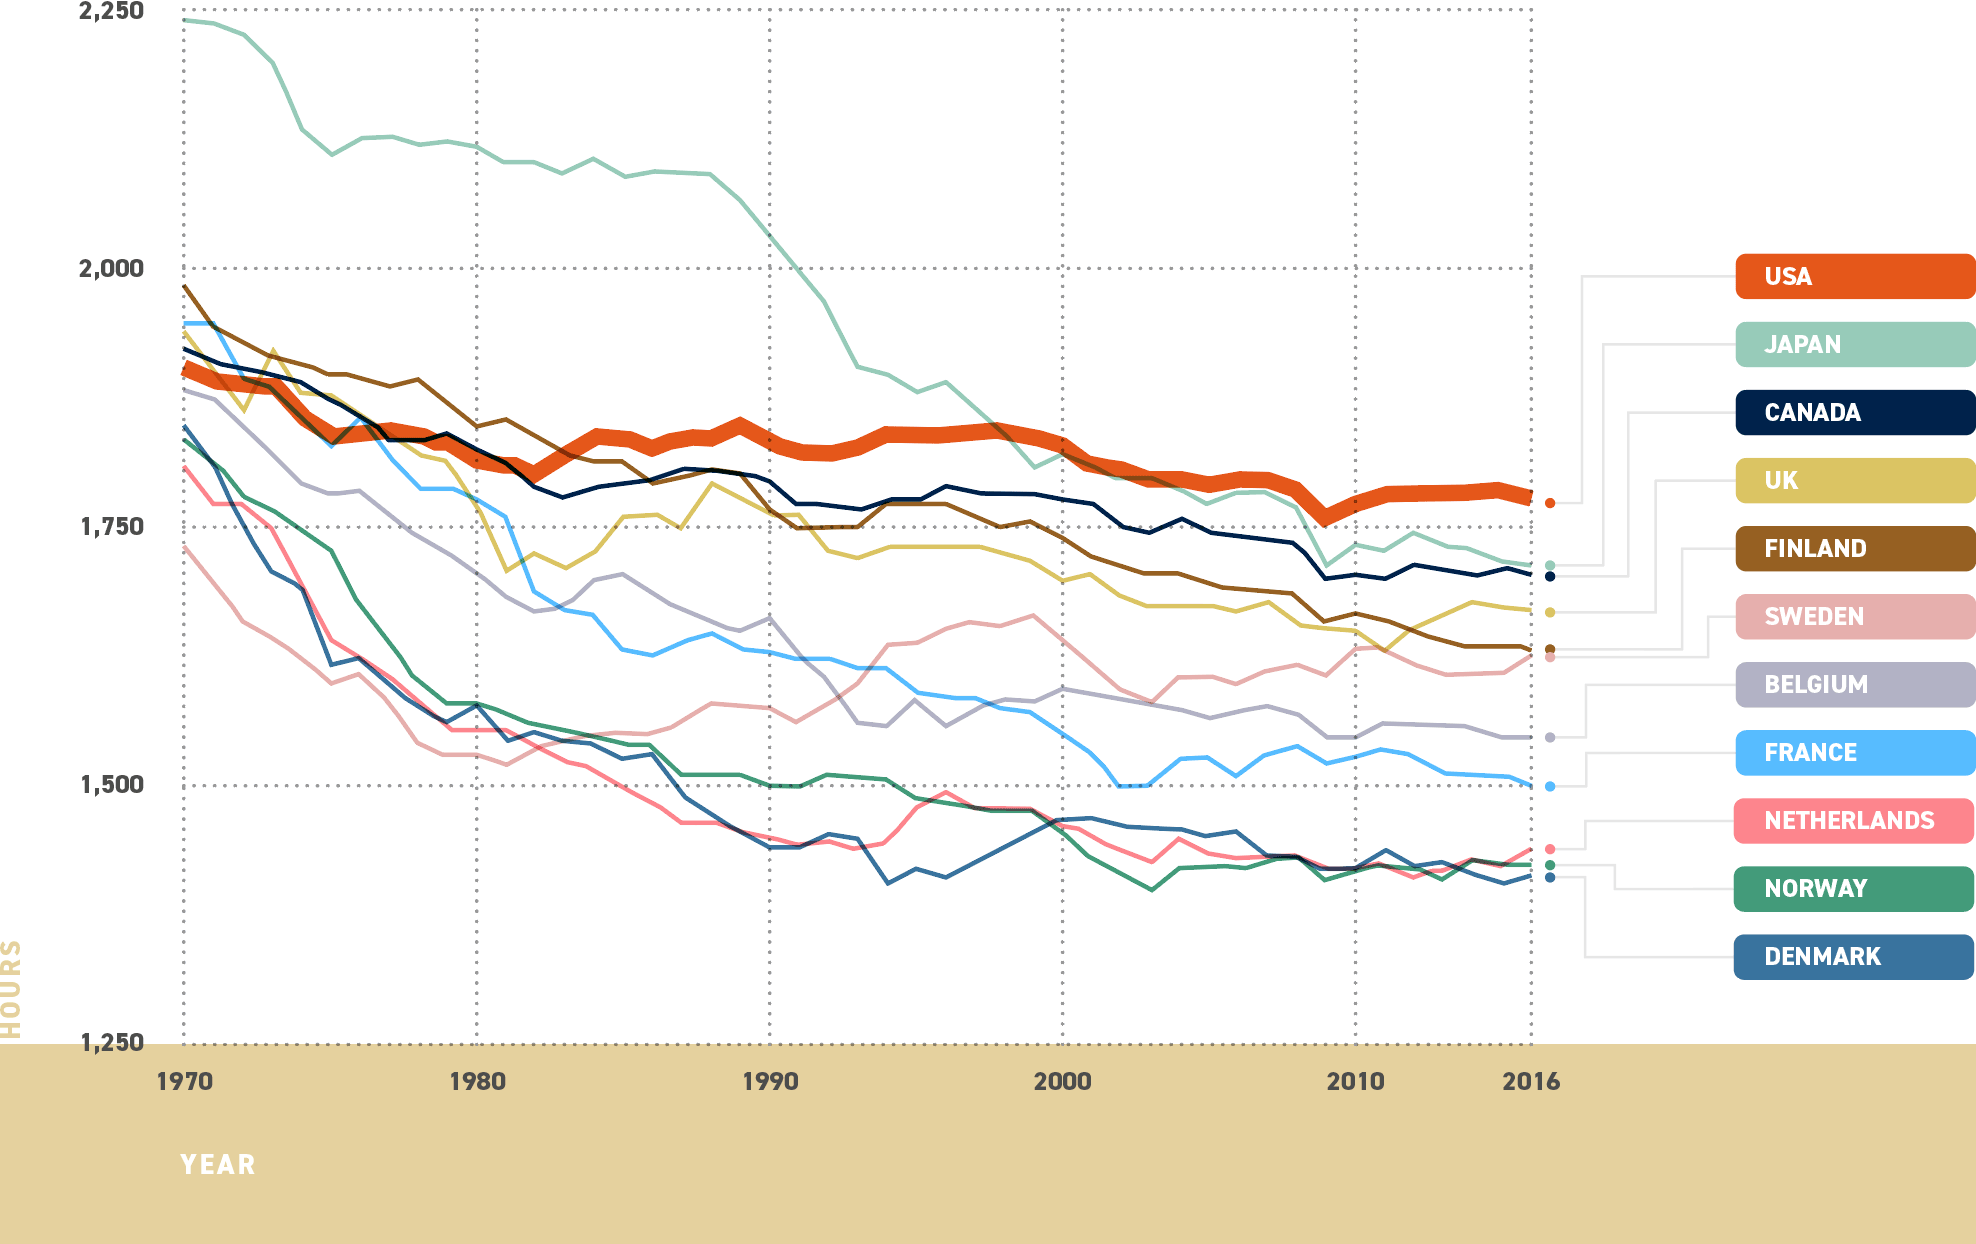
Americans worked a collective 270 billion hours in 2017, 1,739 hours for every worker.1 These numbers mark an extraordinary burden of labor in our country: millions of people are spending far too much of their waking lives ensnared in needlessly excessive hours of work.

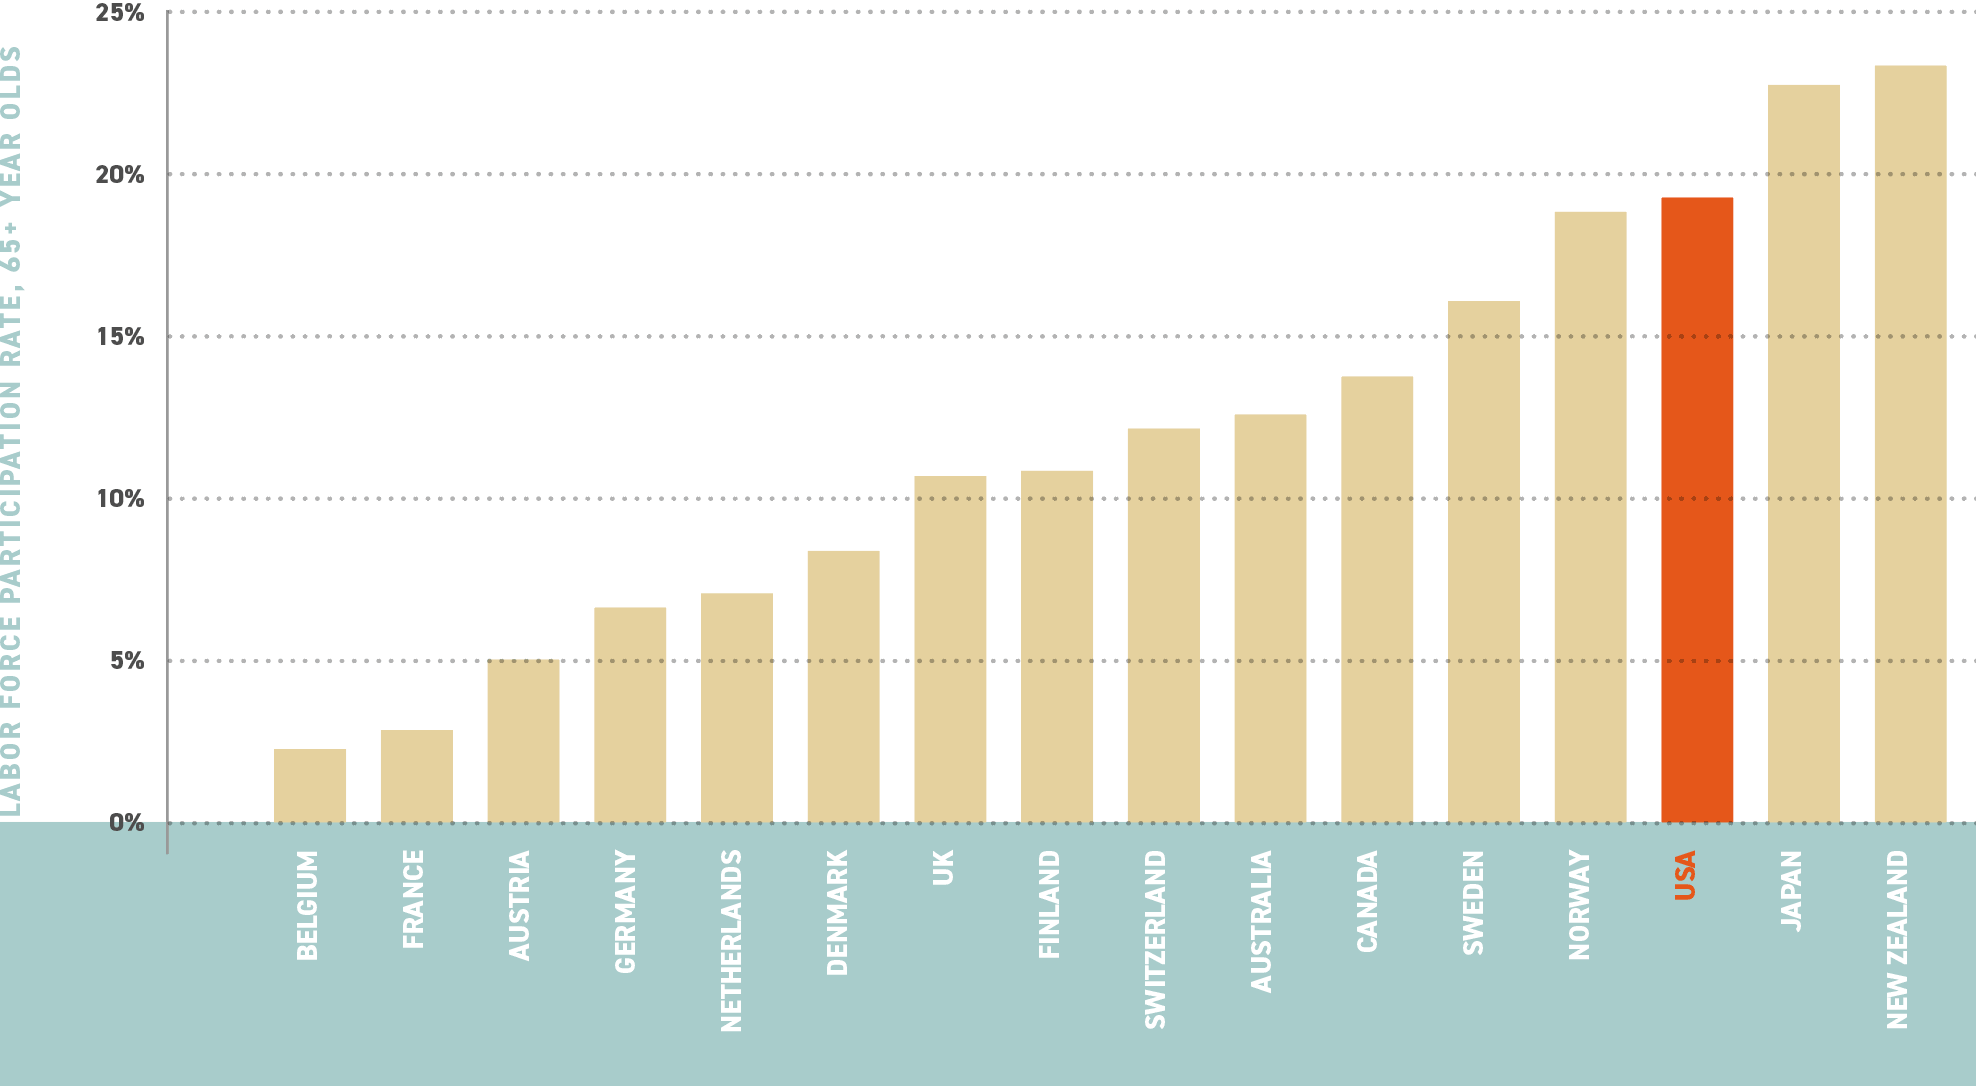
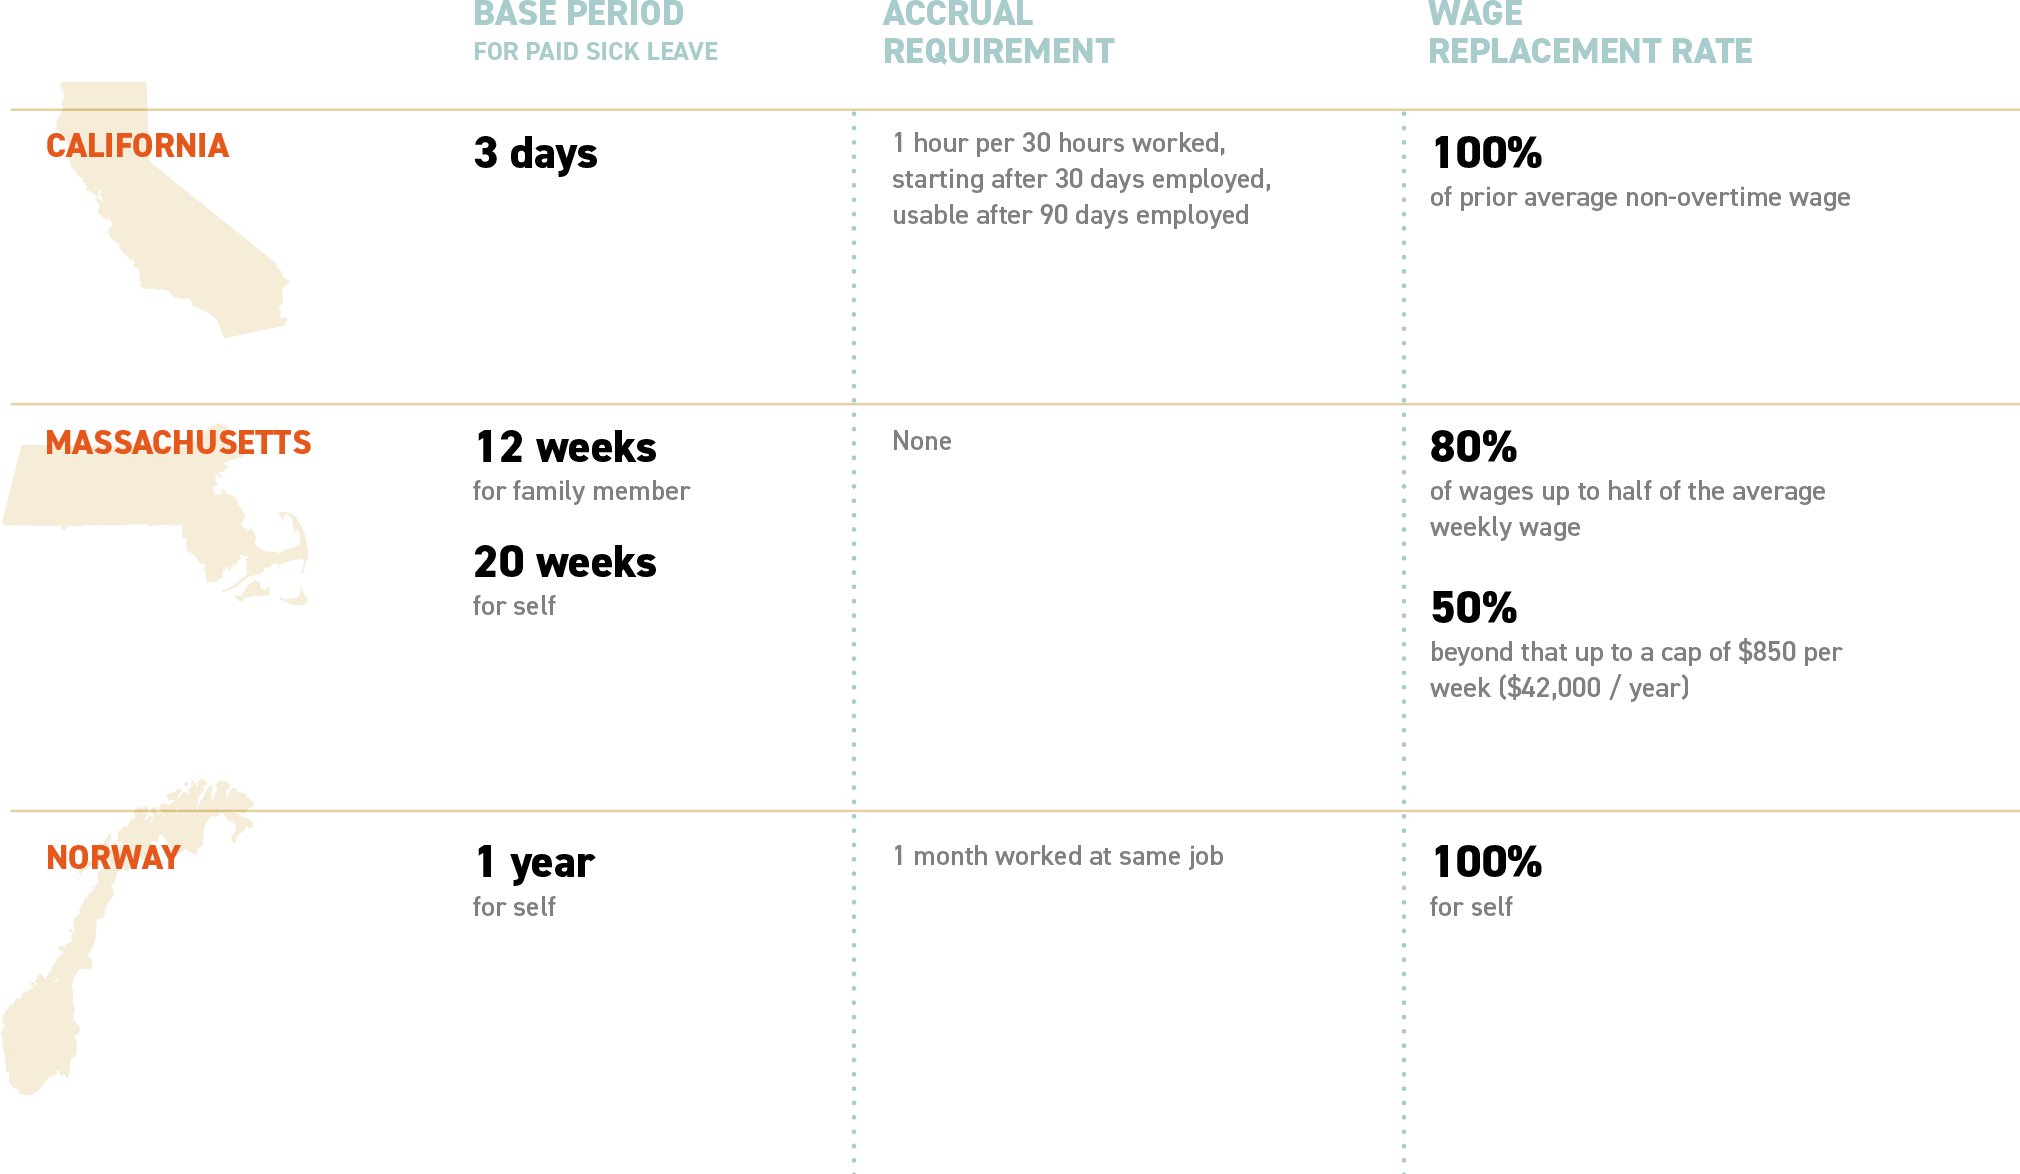
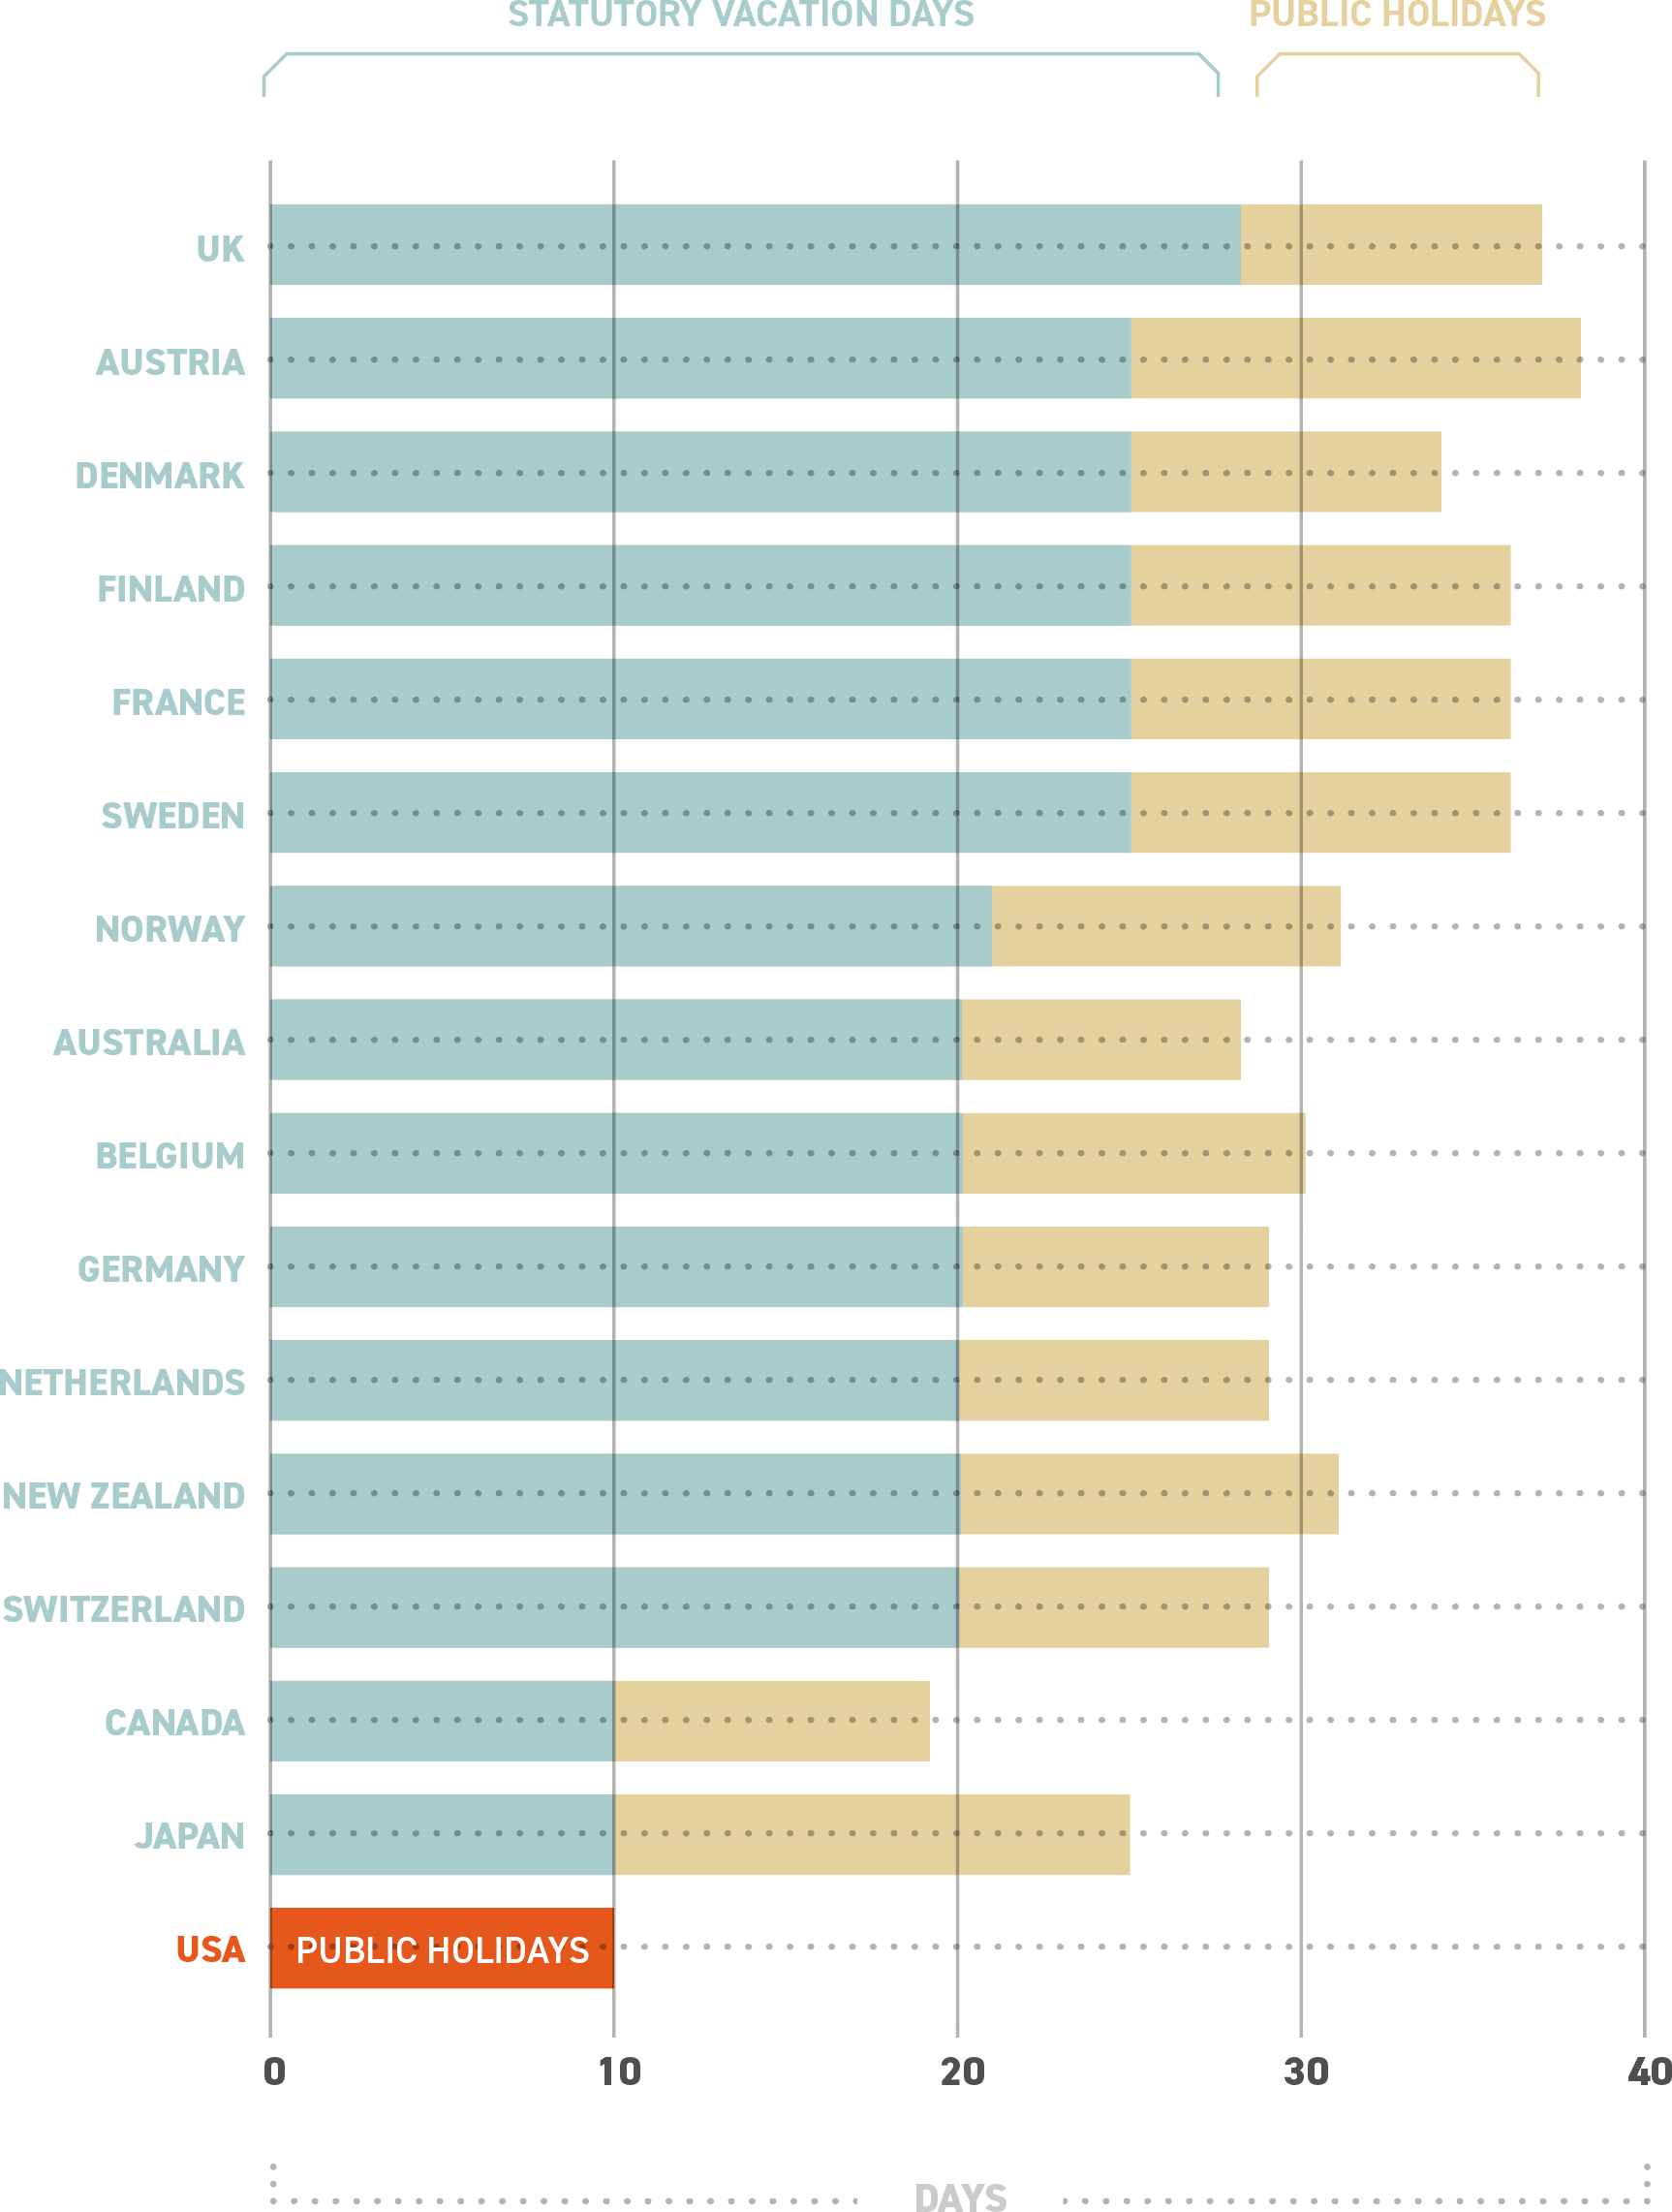
Too many Americans have no vacation days, or very few, or they are not paid enough to enjoy them properly. Too many Americans work hundreds of hours of unpaid overtime, or are forced to choose between parenthood and employment. Too many Americans are spending their twilight years in front of a cash register because they can’t afford a real retirement.

Machinist

But it doesn’t have to be this way. With some simple and easy reforms, the United States could greatly increase the leisure time enjoyed by its workers. America has long since solved the hard, labor-intensive problems of economic production. This is a very rich country; we can afford to make sensible and morally urgent changes to our labor system.

In this paper, I will outline some of the problems plaguing the American labor market, and then suggest several policy solutions to fix them.

Part One The Grind

Too Much Work

Fruit vendor sorting oranges

Hours Worked Among Nations

Americans work far, far more than their counterparts in peer European nations. The Organization of Economic Cooperation and Development (OECD) collects national statistics on labor, which are shown in Figure 1.2 In one year, the average American worker labors more hours than the average worker in any peer nation.

chart
Figure 1
Hours worked by selected OECD country (2016) Source: OECD
Barber giving haircut to a child

This trend becomes even more pronounced when we consider the wealth of different nations. Across almost all countries, the richer a nation is, the less time its workers spend on the job. Intuitively, this makes sense: the more output a nation’s economy is producing per unit of labor, the more free time workers can have.

European countries have typically chosen a mix of greater wealth and greater free time—but the United States is different. Figure 2 shows a plot of GDP per hour worked compared to working hours for all countries in the OECD (except Ireland and Luxembourg, as their output is inflated due to tax shelter activity, and Turkey, for which hours-worked data are not recently available).3 This provides a good measure of how countries have chosen more leisure time as their productivity has advanced. The trend line is strong—but so is America’s outlier position:

chart
Figure 2
Hours worked vs. GDP per hour worked (2016) Source: OECD

Alternatively, we can calculate the distance from the trend line in hours, and thus calculate how overworked or underworked each country is relative to average behavior. Figure 3 shows that the US works 269 more hours than its enormously wealthy economy would predict—making it by this measure the second-most overworked country in the world, just slightly behind Iceland.

Woman quality-checking mechanical parts
chart
Figure 3
Distance from Productivity vs. Hours Worked Trend (2016) Source: OECD
Early-twentieth-century factory staffed entirely by women

America: a historical laggard

Another way of conceptualizing American overwork is by looking at the past. As most nations have gotten richer, their average worker has worked fewer hours. But this is not true of the United States. As shown in Figure 4, among wealthy OECD nations with data going back that far, the U.S. was in the middle of the pack among rich nations in 1970. Now, it works the most out of any in this cohort.

chart
Figure 4
Average Hours Worked per Laborer by Country (1970–2016) Source: OECD
Man hauling rebar

Alternatively, we can examine how average working hours have dropped among wealthy nations since 1970, as seen in Figure 5. Just Sweden has dropped less than the U.S., but only because Swedes worked the least in this group in the 1970s and have since drifted towards the middle.

chart
Figure 5
Change in Hours Worked by Country (1970–2016) Source: OECD

Not Enough Support For Those Working

Meager unemployment benefits

American work is obtained by an unusually brutal labor market, with only meager support for the unemployed, and virtually nothing for people who have dropped out of the labor market. Take unemployment insurance, or payments to workers who lose their job. This varies considerably across countries, both in funding and in institutional structure, but one way to take a quick glance to see how much income drops during a period of unemployment. Figure 6 shows a comparison among peer nations.4

Stylized scene of a worker applying for a job

The supposed aim of making unemployment brutally unpleasant is to horsewhip people into the labor market, but many simply give up altogether instead.5

chart
Figure 6
Net replacement rate of short-term unemployment benefits (2016) Source: OECD

Poor family benefits

Coal miner with his young daughter

The United States presents three major challenges to working parents. First, since raising a child takes so much time, energy, and money, parents have little time to work. Second, even when a child is old enough to be placed with a nanny or in daycare, this can be prohibitively expensive. Third, compounding both other problems, is the fact that prime childbearing years are in young adulthood—when people are starting their careers and their salaries are usually at their lowest point.

These obstacles were more manageable in previous ages when it was feasible to support a family on one middle-class salary. But since the 1970s, both parents generally have had to work if a family is to remain solvent—even those who are quite far up into the upper-middle class. Additionally, of course, many women rightly want an equal chance at jobs and career success.

Technician repairing a computer

That’s why other countries have put welfare institutions in place to assist with parenthood. Part of the typical approach is paid family leave, in which new parents receive public benefits while they take time off work to care for an infant, and some sort of daycare subsidy to cover the time between infancy and school age.

The United States is virtually alone among all nations in providing no paid leave policy at the national level. Table 1 shows a comparison of selected peer nations (with some institutional details omitted for the sake of brevity).6

table
Table 1
Paid Maternity Leave Systems, 2014
Elderly librarian organizes a card catalog

Retirement failure

Retirement in the United States has traditionally rested on three pillars: Social Security, pensions, and private savings. The latter became particularly important starting in 1978 with the partly-accidental creation of the 401(k) tax benefit, which incentivizes workers to save and invest by allowing them to defer taxes in those accounts until after they retire.7

All three of these pillars are in various states of disrepair. Social Security was cut as part of a 1983 reform bill which reduced benefits and advanced the age at which full benefits can be claimed.8 Pension payments relative to previous income, meanwhile, are in the United States considerably below the average among wealthy nations.9

chart
Figure 7
Net pension replacement rates (2016) Source: OECD
Amtrak train porter

Additionally, the average figure here tends to overstate the generosity of Social Security for poorer retirees. Where many OECD countries have a flat pension baseline that all retirees get, the Social Security old-age pension in the U.S. has no minimum benefit, so seniors with low or no earnings history receive no benefits.

Meanwhile, defined-benefit pensions have declined substantially, and 401(k)s have proved to be an awesome policy disaster. Instead of enabling middle-class savers to build up their nest eggs, the vast bulk of 401(k) assets are accounted for by the wealthy.10

Using the Survey of Consumer Finances from the Federal Reserve, I calculated that 40 percent of households aged 50–64 have nothing at all in a personal retirement account. Two-thirds in that age group have less than one year of income saved up in retirement accounts.

chart
Figure 8
Retirement-assets-to-income ratio by percentile for ages 50–64 (2016) Source: Survey of Consumer Finances
Construction worker with a bemused smile

Some commentators argue that we should not look only at explicit retirement assets but also at overall net worth for these purposes. I do this in Figure 9 below. Around 30 percent of households between the ages of 50 and 64 have a net worth that is less than 1 year of income. Three-quarters of households have net worths that are less than 7 times their income, which is the amount retirement advisors commonly say 55-year-olds need to have achieved to secure their retirement.11

chart
Figure 9
Net-worth- to-income ratio by percentile for ages 50–64 (2016) Source: Survey of Consumer Finances
Two chocolate-factory workers inspect desserts

Meanwhile, 401(k) accounts are generally complicated and burdensome to navigate. Many eligible workers refuse to enroll due to procrastination or fear of the vast industry of financial swindlers spawned by these credits whose business model is tricking people into high-fee plans.12

Finally, there is evidence that large swathes of the population simply cannot afford to save more than they currently are. Early withdrawals from 401(k) accounts mean steep tax penalties, but many have done it anyway, especially when times are hard. A Federal Reserve study found that at the bottom of the Great Recession in 2010, early withdrawals from people under 55 were nearly half the size of contributions.13

Diagram of the turning radius of a forklift

Taken together, America’s retirement institutions are failing U.S. seniors. A huge fraction of the over-65 population simply cannot afford to retire—employment rates among this population have increased sharply recently, rising from 12.8 percent in 2000 to 18.6 percent in 2016.14 Bankruptcies are also skyrocketing among this cohort, more than doubling between 1991 and 2018.15

The American employment rate among prime working-age people is considerably below the developed world standard. But its employment rate among people over age 65 is the opposite—as Figure 10 shows, dramatically above peer OECD countries:

chart
Figure 10
65+ labor force participation rate by country (2016) Source: OECD
Two workers repairing furniture in an upholstery shop

Not only does America fail to provide jobs to many people who could take them and need them, it also fails to retire a significant proportion of its senior population.

Sick leave

Painter applies a brush to the exterior of a building

Illness often limits our ability to work, and virtually everyone gets sick occasionally. To prevent such routine occurrences leading to the loss of a job—and employees from coming to work sick and infecting their co-workers—sensible countries require some paid sick leave for most workers.

But not the United States, which lags well behind even middle-income countries in this arena. As a World Policy Center meta-analysis16 details, the U.S. and South Korea are the only OECD countries without any national sick leave program.

Today, a handful of individual U.S. states do have a sick leave program—but most are pathetically meager, and even the most generous are still not as good as the most advanced peer nations. Table 2, for example, compares the California17 system, the new Massachusetts18 system (which was hugely upgraded in late 2018), and that of Norway:19

table
Table 2
Paid sick leave systems
Pacific Maritime longshoremen lining up at the payroll windows

Supposedly liberal California is about 5 percent of the way to a first-class system, even setting aside its onerous qualification procedure. Massachusetts will be in the same league as peer nations if it is fully implemented (it will not actually start collecting revenue until mid-2019, and benefits will not be disbursed until 2021). But even then, it will only cover about 2 percent of the U.S. population.

Vacation days

Finally, there is just plain old time off work. Most countries have holidays of some kind to commemorate religious (or quasi-religious) celebrations, important historical events, or seasonal markers. Then, following the usual pattern of nations purchasing better lives for their citizenry as they become wealthier, most rich nations have added a paid leave requirement for workers.

Senior citizens enjoying a swimming-pool aerobics class

The details, eligibility requirements, and funding systems vary enormously between countries. But the general trend, shown in Figure 11,20 is clear: As usual the U.S. is far, far behind peer nations. It does at least have some public holidays, but unlike every other wealthy nation, no statutory leave whatsoever.

chart
Figure 11
Vacation days by country (2016) Source: OECD
Cutaway diagram of a factory elevator

Not shown in this chart is whether the public holidays are required to be paid, which varies quite a lot between (and even within) countries. But the U.S. has no such standard, thus making it the only OECD country with no required paid time off whatsoever.

All told, America is about two generations behind the curve with its labor time institutions. Americans as a whole are swimming in wealth, but have little free time in which to enjoy it.

Part Two For What We Will

Luckily, all the above problems are easily fixable. Reforming the American job market to reduce working hours, spread jobs more widely throughout the working-age population, help ensure employment, and enable parenthood and retirement would be quite straightforward.

The basic strategy will be to follow the model of cutting-edge European countries, adapted where necessary for an American context.

Party time

Santa Claus being brought ashore in a boat carrying gifts

The simplest way to cut back on working hours is to add multiple new federal holidays. Currently there are 10, spread somewhat unevenly throughout the year. March, April, June, and August have none at all, while November and January both have two. If we add one to each of the months missing a holiday, and then one more at some point, that will make for an even 15, or three weeks total.

These holidays should generally be stipulated to either always fall on a Monday or Friday (so as to maximize 3-day weekends), or if a fixed date is chosen, such that the actual vacation day honored will fall on the nearest Friday or Monday.

Many employers have a policy of following the federal government practices on holidays, so these should take partial effect just through that channel. However, employers could be incentivized to honor the holidays by requiring 50 percent extra pay for work performed on those federal holidays, including for salaried workers.

Mandated vacation

New Years partiers aboard a boat

The second-simplest strategy for reducing working hours is legally mandating vacation time for all workers. Denmark provides one excellent example of this approach: it mandates 5 weeks of vacation per year for most employees, in which paid vacation days accrue at the rate of 2.08 days per month. All workers are eligible for the full 5 weeks, but only workers who have been employed for at least a full year will get the whole time paid as well—though this will change to include all employees (even recently-employed ones) starting in 2020.21

To ease the adjustment process, a United States Vacation Act could start with mandatory 2 weeks vacation for all workers, with an additional week added every year until 4 weeks is reached. Meanwhile, paid vacation would accumulate at whatever rate accumulates a year’s worth of vacation over one year of work (1.17 days per month for a 2-week standard, 1.25 days per month for 3 weeks, and so on).

Paid and sick leave

Father bottle-feeding his infant

The United States should construct a paid leave program for new parents, increasing the current baseline of 12 weeks of unpaid leave for some workers to 36 weeks of publicly-funded paid leave for every newborn or adoption. Where there is one custodial parent, they will be entitled to the full 36 weeks. Where there are two custodial parents, each will be entitled to 18 weeks but also be permitted to transfer up to 14 of their 18 weeks to the other parent.

Individuals on leave will receive a benefit equal to 100 percent of their earnings up to the minimum wage and 66 percent of their earnings beyond the minimum wage. The minimum benefit, which everyone will be eligible for even if they do not have prior earnings, will be the minimum wage and the maximum benefit will be the national average wage.

Commercial postcard advertising a recovery harness

Meanwhile, the federal government should set up a new sick leave program. All employees who have worked for at least one month will be eligible for up to 12 months of sick leave at the same income replacement rate as the paid leave program, conditional on a doctor’s signed confirmation that one is too ill to work. The first month will be paid by the employer, with the government picking up the rest. (People who are still sick after 12 months will be considered disabled and folded into the Social Security Disability Insurance system.)

Unemploy­ment benefits

Workers line up outside of a Canadian employment office for pulp mills and logging

To reform the current unemployment structure, the government should federalize the current state-run system and implement unemployment benefits that provide 52 weeks of coverage at a 60 percent income replacement level up to the national average wage.22 The requirement that unemployment must not be caused by the worker should also be removed.

In addition to regular unemployment benefits, the government should set up a jobseeker allowance for people who wish to work but have no work history or otherwise do not qualify for unemployment insurance. This would be similar to the Finnish system: a flat, modest benefit with minimal activation requirements.23

Social Security old-age pension increases

Group of elderly women playing mah-jongg

Currently the average Social Security benefit is $1,417.24 This is calculated based on a formula applied to an inflation-adjusted average of one’s 35 highest-earning years up to the payroll tax cap ($128,400 in 2018). Most recently, the figures are 90 percent of the first $926 in previous monthly earnings, 32 percent of earnings between $926 and $5,583, and 15 percent of earnings above that, up to the cap.25

To compensate for the retirement problems noted above, the eligibility age for full Social Security should be returned to 65, the income-replacement rate should be increased substantially, and a minimum old-age benefit should be established that is at or above the poverty line for a single adult.

Elderly man plays a tuba outdoors

It is impossible to abstractly determine what the precise income-replacement rates should be as any selection is somewhat arbitrary. But, in broad terms, we should be aiming for old-age benefit levels that enable us to bring our elderly employment rates down to the OECD average of elderly employment rates. Proposals moving the program in this direction have already been developed. Senators Bernie Sanders and Elizabeth Warren, for instance, have created a congressional caucus to push the idea. They have submitted a bill26 which would remove the payroll tax cap, increase benefits across the board, switch to a more generous inflation calculation, and boost up the minimum possible benefit.

Con­clusion

Archival photograph of garment workers

For most of recorded human history, the vast majority of people have been peasants, providing the food that supported all the various priests, nobles, or kings. It meant a lot of hard manual labor, with diseases and childbirth taking a heavy additional toll. But farming techniques changed very gradually, if at all—any peasant could count on his children growing the same crops in more or less the same way he did.

All that changed with the Industrial Revolution. For the first time in history, the world saw spectacular and sustained increases in economic productivity—that is, more production with less work, in manufacturing and farming alike. This caused tremendous social upheaval, as new efficient factories drove millions of individual manufacturers out of business. Peasants were driven off the land and into polluted cities in Europe, while India and China were forcibly deindustrialized by imports brought in at gunpoint—leading directly to devastating famines.

Blurry image of a factory worker as he quickly moves between tasks

However, the worst of that disruption has long since passed in rich countries. America has today piled up well over two centuries’ worth of consistent productivity increases. Modern U.S. workers are dozens of times more productive than those of the 18th century.

Status quo apologists like Steven Pinker argue27 that liberal capitalism more or less automatically produces broad quality of life improvements. But the above analysis proves that the productive resources developed by economic advancement provide only the potential for improvement—they must be actively harnessed by state policy to actually benefit the broad population.

Warehouse worker labors in an aisle full of shoeboxes

Indeed, this is not even the first time America has been forced to learn this lesson. For nearly the whole of the 19th century, as the U.S. economy exploded in productivity, the average height and lifespan of American citizens fell steadily—not bottoming out until the 1890s.28 It took strict regulations in sanitation, food purity, workplace safety, and many other areas during the Progressive Era and the New Deal for those potential improvements to be realized. In this and in many other respects, America today is re-learning the lessons of a century ago.

Four jubilant water-skiiers enjoy a vacation

However, America’s current pathetically backward labor system is, in a way, a blessing. It is not necessary to innovate new institutional forms or experiment in untested policy areas, as it was back in the early 1900s. Copy-pasting proven models from wiser nations, and learning from America’s own history, is mostly all that is needed. With just a few such reforms, the American worker could be living a life of near-incomprehensible luxury.