
In the 1980s, the economist Robert Solow quipped that “you can see the computer age everywhere but in the productivity statistics.” There’s a similar dynamic going on in the Democratic primaries. Doubts about Bernie Sanders’ electability are legion among political observers, yet polls regularly show him performing near the top of the 2020 pack in matchups against Trump.
Polls go up and down, of course, but over the past two months Sanders’ average performance in matchups against Trump, according to Real Clear Politics, generally stood above those of Bloomberg, Buttigieg, Warren, and Klobuchar, and typically just a few tenths of a percentage point behind Biden. Evidence of Sanders’ unelectability, to paraphrase Solow, can be found everywhere except in nationally representative surveys.
But in a paper released last week, David E. Broockman and Joshua L. Kalla, political scientists at Yale and Berkeley, seem to lend credence to the skeptics’ position. The scholars claim to find that Sanders’ apparent electability in polls is illusory because — as Vox put it in a widely circulated write-up of the findings — the Vermont senator “would drive swing voters to Trump and need a youth turnout miracle to compensate.”
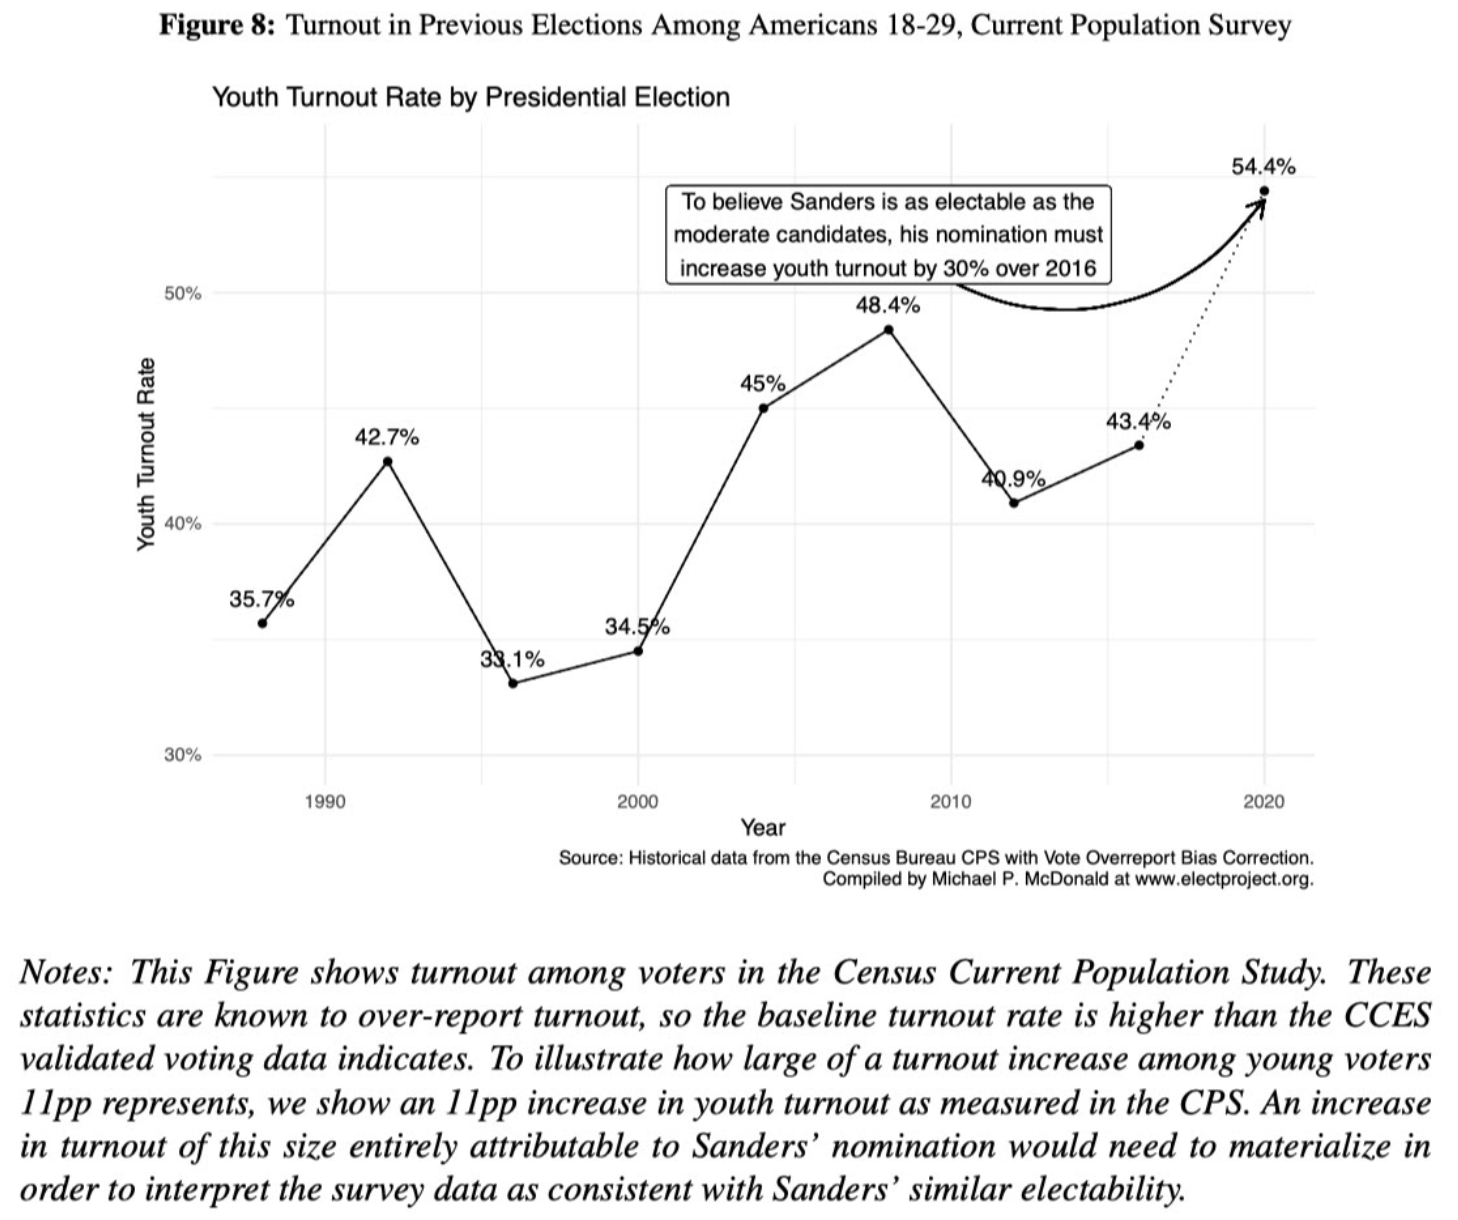
Most strikingly, the paper and the Vox summary included a chart purporting to show what that “youth turnout miracle” would have to look like. In the scenario it depicts, “youth turnout” appears to jump implausibly by 11 percentage points — from 43% in 2016 to 54% in 2020 — beating its all-time modern record of 48% (in 2008).
This “11 percentage point” factoid is the paper’s marquee finding, cited in its abstract and mentioned in untold numbers of articles and social media posts discussing the paper. As people tend to do when they come across evidence for something they already believe, anti-Sanders pundits and journalists joyfully embraced the message,.
But they shouldn’t — because the 11% figure is bogus and the paper is irredeemably flawed.
The chart is a hopeless mess and almost everything it shows is wrong. The main argument the paper makes is that the only way Sanders could retain his relative strength in polls (compared to moderates like Biden) in an actual general-election contest is if there were an improbable “youth turnout surge” — which they estimate at “11 percentage points.”
The authors get this idea from the fact that a certain category of young people — mainly Democrats and independents in the 18-34 age bracket — currently boost Sanders’ relative standing in the polls by saying they would turn out to vote for Sanders but would not turn out for a moderate Democrat.
According to the authors, these Bernie-or-Bust respondents represent about 11 percent of all non-Republican 18-34-year-olds, which means that if they all turned out to vote for Sanders, the turnout rate for the “non-Republican 18-34-year-old” demographic would be 11 percentage points higher than it would be if Joe Biden were the nominee and they all stayed home.
At some point in the authors’ thought process they appear to have confused this counterfactual difference in turnout — the difference between a world where Sanders wins the nomination and a world where Biden does — with a sequential increase in turnout that occurs over some historical time period — say, from 2016 to 2020.
That is presumably how they were able to produce the chart above, a disastrous tangle of confusions and errors. The chart’s solid line shows the trajectory taken by the actual youth turnout rate between 1996 and 2016, as reported by the Census Bureau. (The Census uses different age brackets than the authors; the solid line here is showing the turnout rate for 18-29-year-olds.)
The dotted line that the authors have tacked onto the chart, tracing out an 11 percentage point jump, is presumably supposed to represent the size of the counterfactual turnout increase implied by the Bernie-or-Busters’ survey responses.
But the unmistakable — and yet completely mistaken — message the chart conveys is that this is how improbably high the “youth turnout rate” would have to climb in 2020 for Sanders to match his current polling strength: 54.4%. The chart even displays an inset containing the totally fictitious claim that, “To believe Sanders is as electable as the moderate candidates, his nomination must increase youth turnout by 30% over 2016.”
It should not be hard to see why this is wrong. If 11% of “non-Republican 18-34-year-olds” say they would turn out to vote for Candidate A but not Candidate B, that tells you nothing about what the actual “youth turnout rate” would be if Candidate A got on the ballot and those 11% all turned out to vote for him.
A Sanders nomination in 2020 could result in a youth turnout rate 11 points higher than what Biden, counterfactually, would have gotten, without any need for Sanders’ turnout to be 11 points higher than the 2016 level. For example, hypothetical Sanders could get a 49% turnout rate, with hypothetical Biden getting 38%. Or he could get 47% with Biden getting 36%.
In no sense would Sanders have to attain any particular level of turnout — let alone the 54.4% rate drawn in the chart — for his turnout rate to be 11 points higher than what Biden would have gotten had he been the nominee.
Conceptually, the chart is a monstrosity. But it also gets its numbers wrong. Recall that the black solid line is showing the percentage of all 18-29-year-olds who voted. But the dotted line, which illustrates the authors’ 11% figure, is referring to a (counterfactual) turnout increase expressed as a percentage of 18-34-year-old non-Republicans. Even ignoring the different age bracket, the authors have chosen an artificially truncated denominator. Expressed as a percentage of all 18-34-year-olds, the 11% becomes 7% (36% of 18-34-year-olds are Republicans, including leaners.)
In addition, about one-fifth of the pro-Sanders respondents the authors counted in the numerator are spuriously included, because they did not actually indicate in the authors’ survey that they would stay home if a moderate Democrat were nominated. (They said they were undecided or would vote third party.) The authors themselves explain this problem in the caption of their Figure 5, but inexplicably use the 11% figure anyway. The correct number, which appears in their Figure 5, is the percentage of respondents who said “I would not vote” if a moderate were on the ballot, and it is 9.2% (using the authors’ incorrect denominator), not 11%.
After correcting both the numerator and denominator, the actual counterfactual turnout is 5.9%, not 11%. For context, the turnout rate for ages 18-29 rose by 10.5 percentage points between 2000 and 2004 and 16.3 percentage points between 2014 and 2018, according to the US Elections Project.
Even with zero increase in youth turnout, Sanders still beats Biden. Remarkably, a separate analysis presented within the paper conclusively disproves the authors’ own claim about Sanders’ need for a turnout surge.
When they re-weight their matchup polls to simulate 2016 turnout patterns — thus ruling out any youth turnout differential between the candidates, by assumption — they still find Sanders outperforming Biden: Sanders’ margin over Trump is +0.8%; Biden’s is +0.2% (Fig. 6, p.12). Despite the authors’ rhetoric about Sanders being dependent on an implausible youth turnout surge, their own analysis finds that he isn’t.
The authors ultimately adjust away Sanders’ electability by making groundless assumptions about voter behavior that evidence from political science decisively refutes. The authors ultimately do obtain a finding that Sanders is comparatively unelectable. But they only manage to do this through an arbitrary data adjustment: imputing a vote for either Trump or the Democratic nominee to the large majority of the survey respondents who actually rejected those two-party choices.
The authors apparently do this because they assume that most voters who initially oppose “their” party’s nominee eventually “come home” and support the party candidate. But analysts who have investigated this question overwhelmingly reject that conclusion. Panel surveys from past elections consistently show that when “thwarted partisans” — those who supported the losing candidate in a presidential primary — tell pollsters that they will not vote for the winning nominee, 60%-70% in fact follow through with the threat.
The bottom-line finding of the authors’ study is that when their survey of 40,000 eligible voters is weighted to simulate 2016 turnout patterns — presumably the most neutral way of forecasting turnout — Bernie Sanders leads Donald Trump by 0.8% percentage points while Joe Biden leads by 0.2%. Sanders is at least as electable as Joe Biden.
Detailed Breakdown
Survey
To investigate how well Bernie Sanders’ poll numbers would hold up in a general election compared to his Democratic rivals, the authors designed an original online survey asking respondents how they would vote in head-to-head general election scenarios pitting Donald Trump against five different potential Democratic nominees: Bernie Sanders, Joe Biden, Pete Buttigieg, Michael Bloomberg, and Elizabeth Warren.
With a sample size of more than 40,000 respondents — dozens of times as large as most commercial polls — the survey allowed the authors to slice the data finely without introducing significant sampling error. Importantly, it also allowed them to avoid having to ask every respondent about every potential matchup — a practice likely to lead in many cases to insincere, strategic answers.
Instead, each respondent was asked about only one, randomly selected matchup, and answers from demographically similar respondents were pooled together to estimate how those voters’ election behavior would likely shift depending on which Democrat was on the general election ballot.
The authors stress that their study was not intended to predict the absolute levels of voter support for Democrats or the outcome of the November election, since polls so early in the election cycle are seen as unreliable predictors of the final vote. (The survey was conducted in January and February of this year.)
Rather, the question the paper asked was, simply: Is Bernie Sanders, the socialist, really as electable as his moderate rivals — as most polls seem to indicate?
The Spurious “11% Turnout Surge”
The authors’ argument unfolds in three logical steps.
First, they confirm the findings of the many public polls that seem to show Sanders to be at least as electable as the moderate candidates. In the authors’ survey, when responses are weighted to mirror the demographics of the entire eligible electorate, Sanders comes out on top in head-to-head matchups against Trump.
The margins against Trump that they find in this initial cut of the data are: Sanders: +4.3%; Biden: +4.3%; Bloomberg: +4.1%; Buttigieg: +1.9%; Warren: +1.1%:
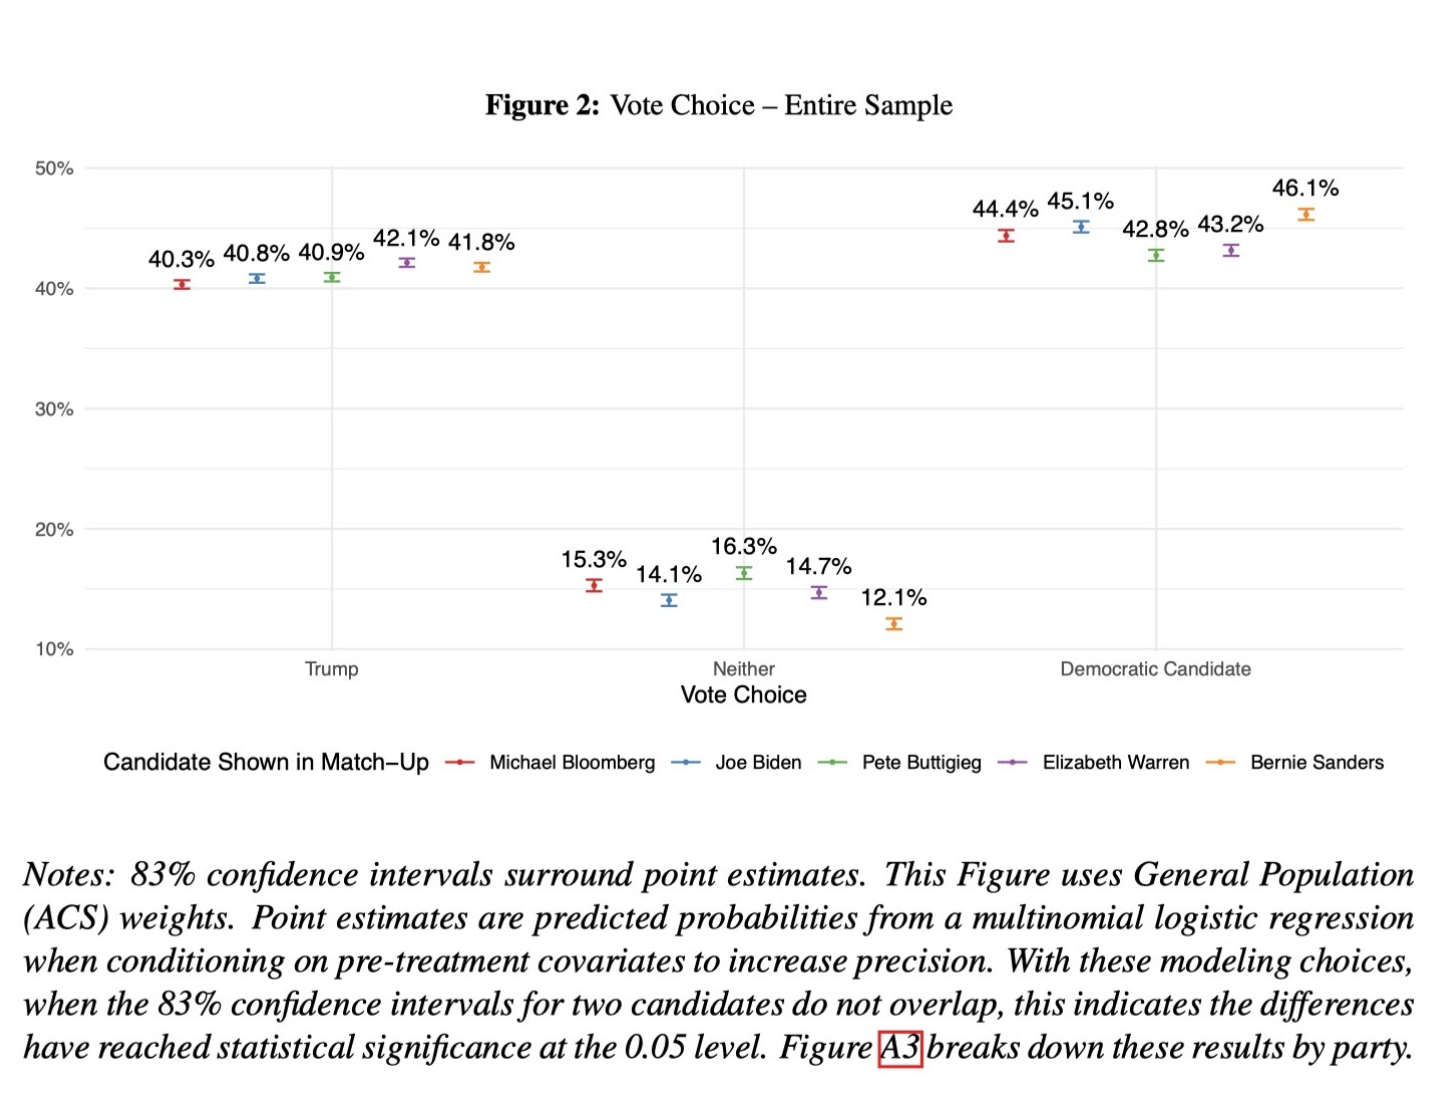
Their second step is to show that these headline figures conceal two crucial patterns going on under the surface.
First, the presence of Sanders on the ballot drives a small but significant number of moderate voters into the Trump camp: about 2 percent of Republicans, for example, say they wouldn’t vote for Trump if his opponent were one of the moderate Democrats, but would vote to reelect him if Sanders were the alternative.
The other pattern that emerges from the data explains how Sanders manages to offset those losses: he attracts a significant bloc of young people — overwhelmingly Democrats and independents under the age of 35 — who boost his relative standing in the polls by telling pollsters that they will vote for Sanders if he’s the nominee but won’t vote for any of his Democratic rivals; that they’ll either cast their ballot for a third party, stay home, or are undecided.
According to the authors, this Bernie-or-Bust group comprises roughly 11% of respondents in the “under-35, non-GOP” demographic. This “11%” factoid then forms the basis for the third and final step of the argument, which is presented by the authors in the following passage and in the chart below:
Sanders’ electability case thus appears to rest on the proposition that nominating him will increase turnout among Democrats and Independents under 35 by approximately 11pp, offsetting his inferior performance among the rest of the electorate.
This chart is the most wildly misleading part of the paper. Anyone who looks at it without closely reading the body of the paper will undoubtedly assume it’s saying that a Sanders victory against Trump would require an 11 percentage point increase in the youth turnout rate, which would take the rate to never-before-seen levels — from 43% in 2016 to 54% in 2020.
But that is not what the study found. When the authors talk about an 11% “increase” in turnout, they are not referring to an increase over 2016 levels; they’re talking about an increase over the counterfactual turnout rate that Biden would get if he were the nominee instead of Sanders. Thus, the dotted line that zooms up to indicate unheard-of levels of youth turnout is pure fiction. Sanders does not need to attain any particular level of turnout for his turnout rate to be 11 points higher than what Biden would have gotten.
In addition, the 11% figure is simply wrong. On the one hand, the denominator is artificially truncated, because it includes not 18-34 year olds as a whole, but only 18-34 year old non-Republicans. When expressed as a percentage of all 18-34-year-olds, the “turnout surge” would be 7%, not 11%.
Second, the numerator is too large, because, as the authors admit in the caption to their Figure 5, it includes two categories of pro-Sanders respondents who did not say they would stay home in the event a moderate Democrat was on the ballot. (They said they were “undecided” or would vote for a third party.) The percentage of respondents who actually chose the “I would not vote” option is shown in the authors’ Figure 5: it is 9.2% (using the truncated denominator).
When both the numerator and denominator are corrected, therefore, the actual “turnout surge” number falls from 11% to 5.9%. For what it’s worth, this falls well within the normal range of over-time turnout shifts. According to the US Elections Project, the youth turnout rate (ages 18-29) rose by 10.5 percentage points between 2000 to 2004 and 16.3 percentage points between 2014 to 2018.
All we need to believe, therefore, to credit the scenario the authors claim is so improbable, is that there is a group of voters who make up less than 6% of young people (and less than 2% of the eligible electorate), who would turn out to vote for Sanders but not for Biden. Not only is that not an implausible scenario — it’s what those voters said they would do when they were asked in the authors’ survey.
The Authors Disconfirm Their Own Argument
To substantiate their claim that Sanders would need an implausibly large turnout, the authors’ next step is to explore how the candidate would fare in the absence of any “turnout surge.” To accomplish this, they make two sets of adjustments to their survey data.
In the first adjustment, they simply re-weight the survey responses to reflect the composition of the 2016 electorate rather than the overall adult population. What that means is that each respondent’s candidate preference (or lack of preference) is counted in the poll, but the weight that preference gets when calculating the final result now depends on the predicted probability of that individual’s actually showing up to vote, based on their demographic profile. Young people, with their lower relative turnout rates, now receive significantly less weight while older voters receive significantly more.
With this step, the authors completely eliminate the whole dilemma of how much to trust respondents’ self-reported turnout claims. We no longer have to worry, for example, about whether to believe a 25 year old when she claims that she will turn out for Sanders but won’t turn out for Biden. The authors have ruled out all such behavior by assumption. They have imposed identical turnout patterns on all candidates, eliminating the self-reported differential turnout that boosts Sanders’ relative standing in polls.
As you might imagine, this step significantly alters the performance of the different candidates in matchups with Trump. How does Sanders fare in this scenario?
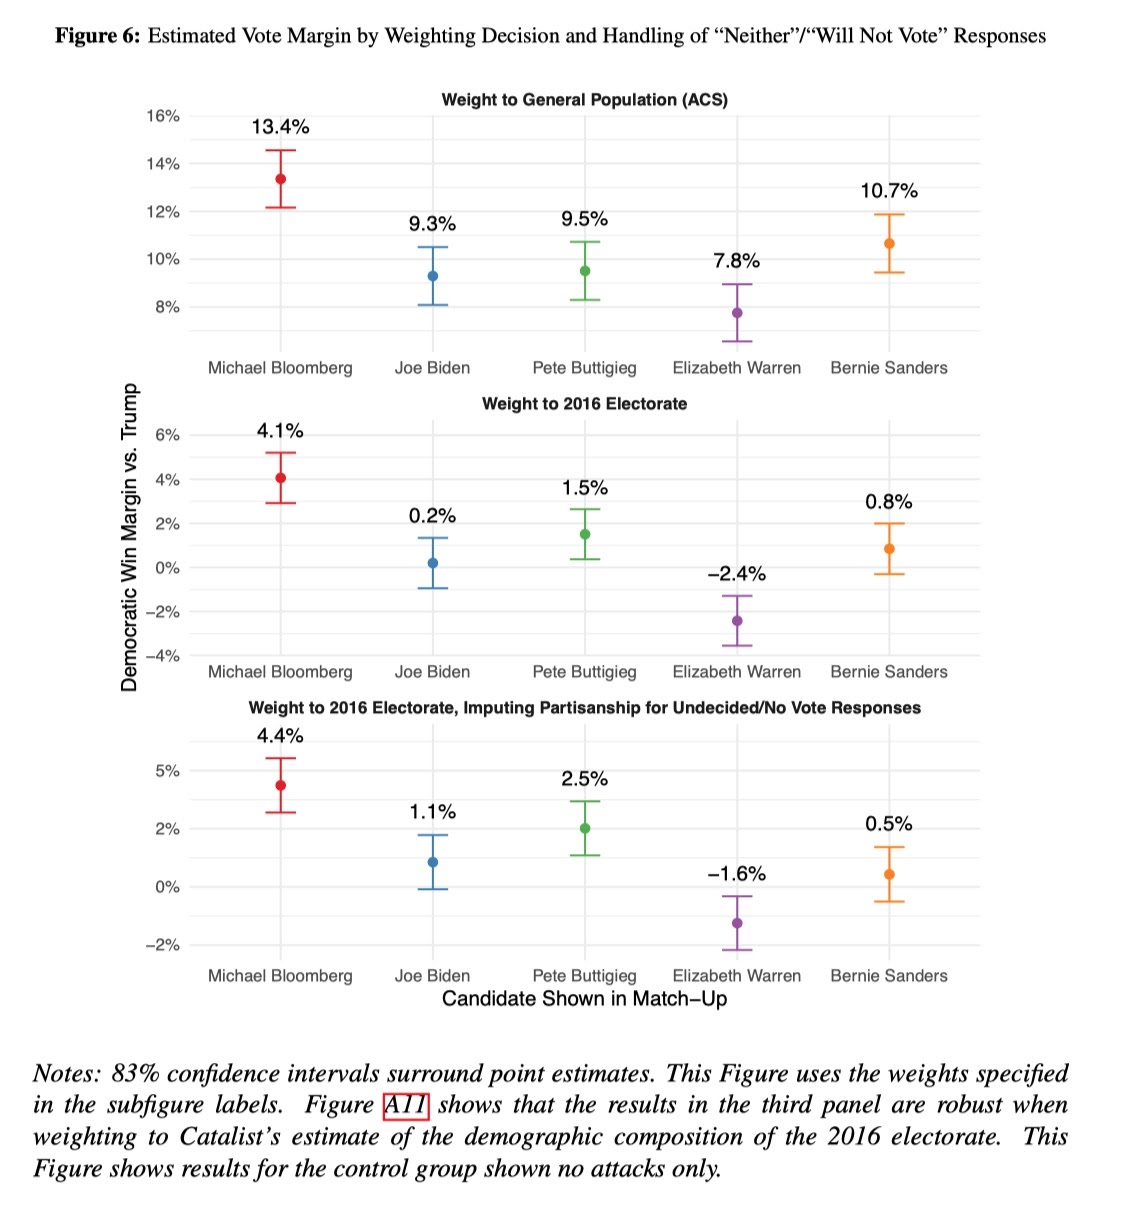
As shown in the figure above, when this re-weighting is performed, Sanders’ vote-margin advantage over Biden in matchups against Trump falls from +1.4% to +0.6%. In other words, before the re-weighting, Sanders’ margin against Trump was 1.4 percentage points better than Biden’s; after the re-weighting it was 0.6 percentage points better.
We should pause to note what this means: despite loudly claiming to have found that Sanders’ relative electability depends on some wildly improbable “youth turnout surge,” what the authors actually found was that Sanders remains more electable than Biden even after all traces of such a self-reported turnout surge have been scrubbed from the data.
Torturing the Data Until It Confesses
How, then, do the authors still conclude that Sanders is less electable? The answer stems from a final — and completely illegitimate — adjustment the authors make to their data.
In all cases, the authors’ survey always shows a significant share of voters — roughly 11% to 15%, depending on which Democratic nominee is posited — who say they would vote for neither major-party candidate, or are undecided. The share is always smallest in scenarios where Sanders is the nominee, reflecting the significant number of Sanders supporters who say they will definitely vote for him if he’s nominated, but who give a different (but non-Trump) answer if the nominee is someone else. (The alternative choices in this survey are: “Undecided”; “A third-party candidate”; and “I will not vote.”)
In the authors’ final data adjustment, they choose to disregard such answers and simply impute a major-party vote choice to most of the respondents who didn’t give one.
Specifically, their procedure was the following: If, after refusing to choose Trump or the Democrat, a respondent answered a followup question (whose wording begins “if you had to choose….”) by conceding that they would “lean towards” one of the two major-party candidates; or if they answered a standard party identification question by saying they identified with or “leaned” toward one of the two parties, they are re-coded as having “voted” for the nominee of “their” party — even if they had actually just rejected that choice.
As justification for this move, the authors cite “evidence that self-reported intent to turn out correlates poorly with actual turnout decisions” (p.10) — but this is obviously a non-sequitur. The fact that many survey respondents claim they won’t vote but actually do, tells us nothing about who they will vote for. The vote-choice imputation the authors make would only be justified if they could point to empirical evidence showing that it corresponds to actual voting patterns documented in past elections. But they have no such data to point to.
On the contrary — their procedure is flatly contradicted by all available evidence. Existing research on so-called “thwarted partisans” (supporters of a losing primary candidate) is consistent in its findings: when such voters tell election-year surveys that they will not vote for “their” party’s nominee, 60%-70% follow through with that decision.
For example:
-
- In 2008, an Associated Press panel survey re-interviewed the same group of voters several times over the course of the 2008 election; its results were analyzed in a 2010 paper by Michael Henderson and Sunshine Hillygus of Harvard and Duke Universities. The survey showed that in June of 2008, roughly 48% of voters who had supported Hillary Clinton in the Democratic primary said they would not vote for Obama in November; when reinterviewed in November, two-thirds of those voters (30% of the total) confirmed that they had indeed voted for a different candidate or, in a minority of cases, had not voted at all.
-
- My own analysis of the 2016 Cooperative Congressional Election Study finds that when Democrats who had voted for Bernie Sanders in the primary (and whose primary turnout was confirmed in the official voter file) were asked in October how they would vote in November, 20% claimed they would not vote for Hillary Clinton (4% said they’d vote for Trump; 11% for a third party; 5% said they wouldn’t vote or were unsure). When reinterviewed after the election, three-fifths of these (12% of the total) reported that they had, in fact, voted for someone other than Clinton (6% for Trump and 6% for a third party; almost all turned out in the general election).
-
- University of Pennsylvania political scientist Dan Hopkins, who is involved with a long-running university-run panel survey, discussed the issue of “thwarted voters” in a recent FiveThirtyEight.com blog post and on Twitter late last year. He noted that in the spring of 2008, his survey found 13% of voters who said they would vote for Hillary Clinton but not Barack Obama in the general election. When reinterviewed in the fall of 2008, 62% of these voters still refused to back Obama: 34% said they would vote for John McCain while another 28% backed neither major-party nominee. Likewise, in January 2016, 11% of the survey’s respondents said they would support Marco Rubio in the general election but not Trump. When recontacted in October, 73% still maintained that stance, with 26% backing Clinton and 48% undecided, planning not to vote, or supporting a third-party candidate.
“The upshot,” Hopkins concluded, is that “if there are voters who say they would back one candidate from a party but not another, don’t assume that they will necessarily come around and back that party’s nominee come November.”
Yet the authors of the study considered here made that unfounded assumption about the vast majority of such voters in their survey. Only by spuriously adjusting the data in this way were they able to show Bernie Sanders falling behind Joe Biden in matchups against Trump — albeit by a mere 0.6%.
Conclusion
If political scientists did not immediately point out the irremediable flaws in this widely circulated paper, one reason was probably the fact that its thesis harmonizes with an existing empirical literature on “extreme” candidates. This literature generally finds that when more “extreme” candidates win primaries, they’re penalized in the general election.
Academics and wonkish commentators often point to this literature as evidence that if Sanders is nominated, he’s likely to perform poorly in the general election. But the literature does not actually provide evidence for that idea. The reason for this is obvious, and yet has profound implications for the way political scientists and other “politics wonks” comment on the election.
Like most quantitative research, the literature on extreme candidates deals in averages. It takes a large sample of cases, each of which is unique, and tries to distill a statistical tendency from them. The statistic is an abstraction. It is not meant to describe any single case; it is only meant to characterize the average tendency among hundreds or thousands of cases.
To illustrate, here is a chart from an influential paper in the extremist-candidate literature. Using a clever research design, it shows how an extremist who performs almost identically to a non-extremist in their respective primaries will, on average, pay a penalty, in terms of votes, in the general election, compared to the non-extremist.
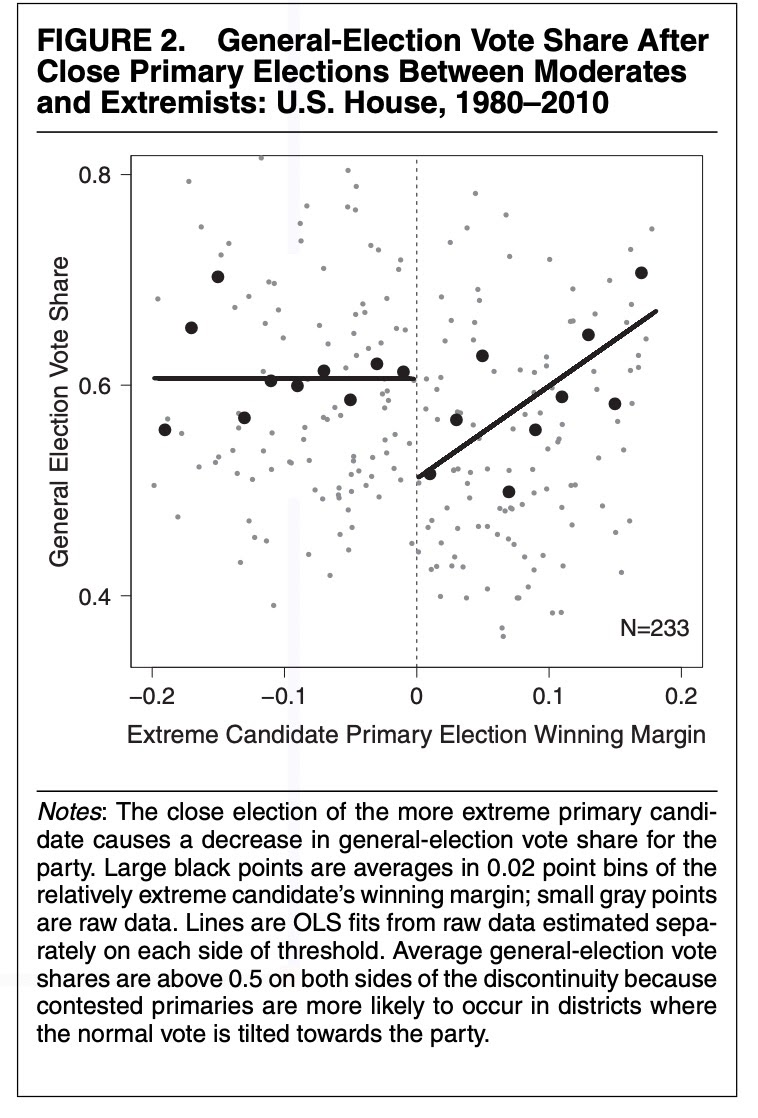
The sudden break in the trendline at the center of the graph shows the penalty paid by the extremist candidates. According to the paper's author, it amounts to around 8-12 percentage points of general-election vote share on average.
That is a large penalty, and Bernie Sanders would almost certainly count as an “extremist” by this author’s definition. Yet none of this tells us anything about Sanders’ likely general-election performance if he wins the nomination. That is because Sanders is not an average of N=233 candidates from 1980-2010. Nor, in fact, are any of the individual cases in the author’s sample.
Even the most cursory glance at the chart will show that there are lots of extremist candidates who, as individuals, are more electable than lots of “moderate” candidates, as individuals. That hardly contradicts the overall findings of this literature, because the literature does not claim that extremism/moderation is the only attribute that matters for a candidate’s electability. Many other factors help determine “candidate quality,” and these, taken collectively, are almost certainly more predictive of election outcomes than ideology alone.
Totally aside from his ideological positioning, Bernie Sanders has shown himself to be a talented politician. In Vermont, conservative political operatives will freely tell visiting reporters that it would be a mistake to underestimate his skills. He regularly wins with double digit margins in towns that voted for Trump.
In fact, it is quite likely that one of the dots in the chart above is Bernie Sanders. In which case, it’s probably to the right of the line and pretty high up.