

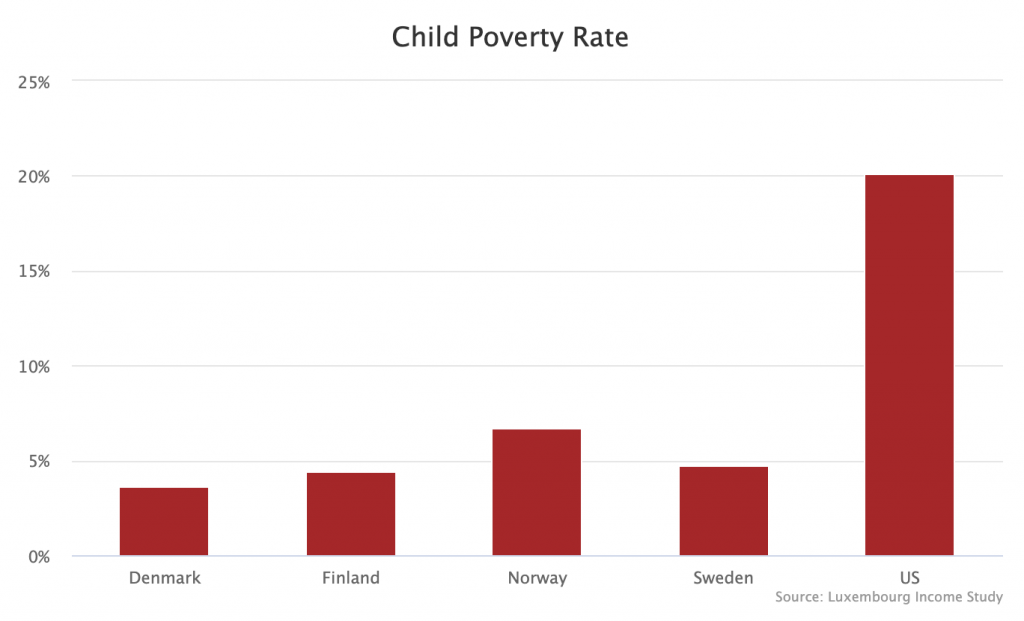
By now, most people who follow these kinds of things are familiar with America's uniquely high level of child poverty. According to the latest LIS data, 20 percent of US children live in families with incomes below 50 percent of the national median income. In the Nordic countries, the same number is 3.6 percent to 6.7 percent depending on the country.
But that's not the only peculiar thing about America's income distribution for children. If you break children into three broad classes, as I do in the graph below, you see something very striking about the American distribution relative to the distributions that obtain in the Nordic countries.
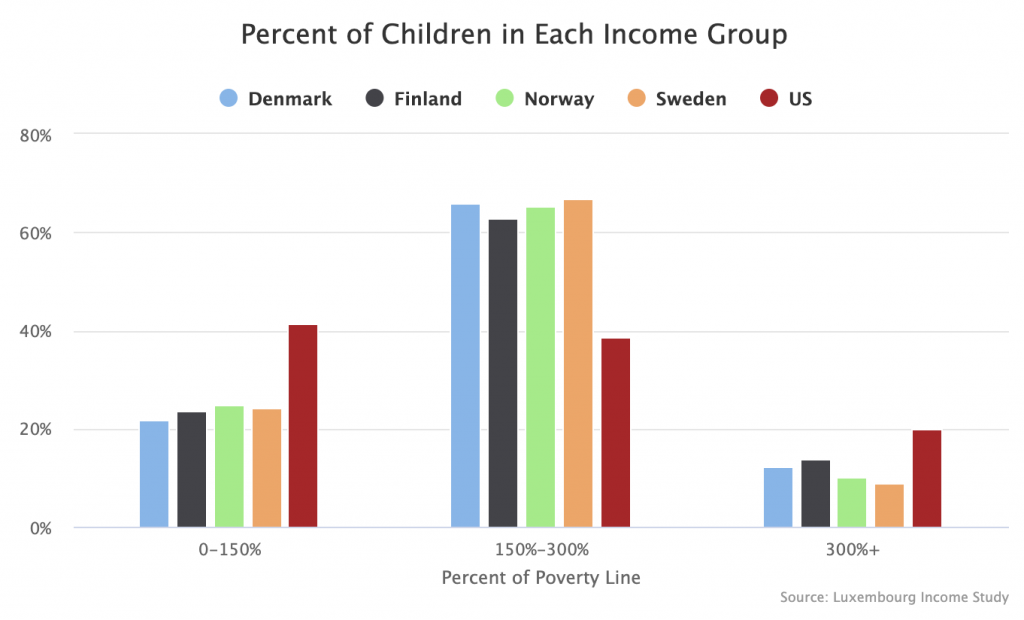
In the Nordic countries, they have relatively few children in the lower class (and even fewer in the extreme lower class). They also have relatively few children in the upper class. But they have big middle classes. Around 65 percent of children in those countries have incomes that are 150% to 300% of the poverty line, which is equivalent to 75% to 150% of the median income.
In the US, on the other hand, there is a big lower class that is even larger than the middle class (so defined). And then there is also a relatively large group of children with incomes well above the US median, i.e. rich kids. While the Nordic distribution looks like a bell curve with the overwhelming majority of kids clustered near the middle, the American distribution is a pyramid.
If you want to fix this bizarre distribution, the way forward is pretty simple. Levy much higher taxes, especially on the rich, and use the revenues to fund universal social democratic programs. When it comes to children, things like free or subsidized child care, free health care, paid leave, and a child allowance would go a long way towards pushing lower and upper class children towards the middle.