David Leonhardt has a piece at the New York Times that argues that eliminating student debt is not progressive. The main point of the piece is that high-income families have more student debt levels than low-income families and that therefore across-the-board student debt relief would benefit high-income families more than low-income families. In light of Leonhardt's article and the flurry of social media activity that followed it, I figured it'd helpful to provide a variety of measures of the student debt distribution.
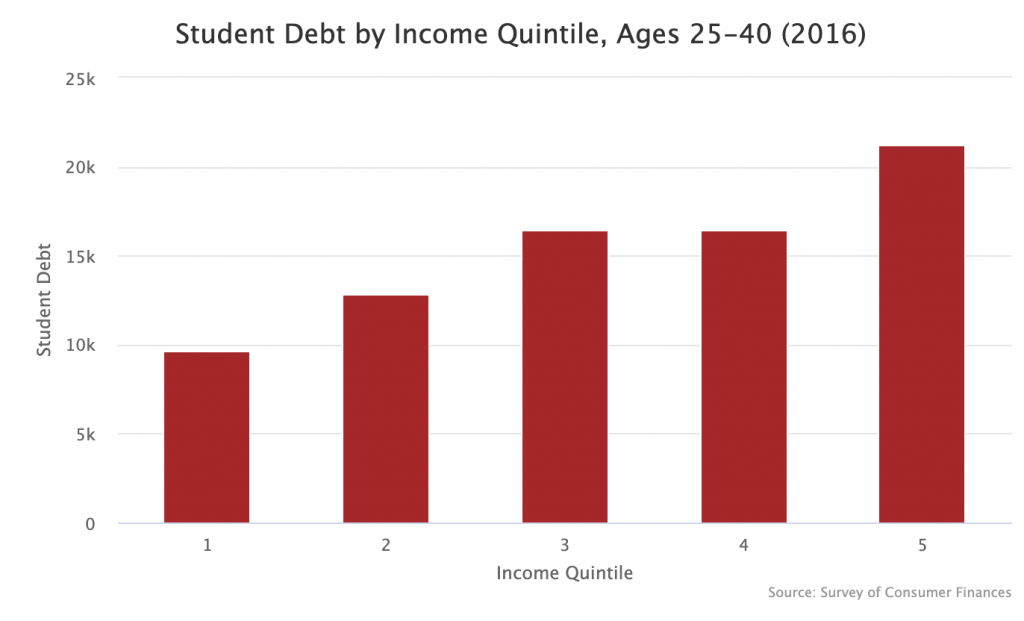
Student Debt by Income Quintile
As Leonhardt noted, student debt is positively related to income. The richest 20 percent of young families have an average student debt level of $21,186 while the student debt level of the poorest 20 percent stands at $9,679.
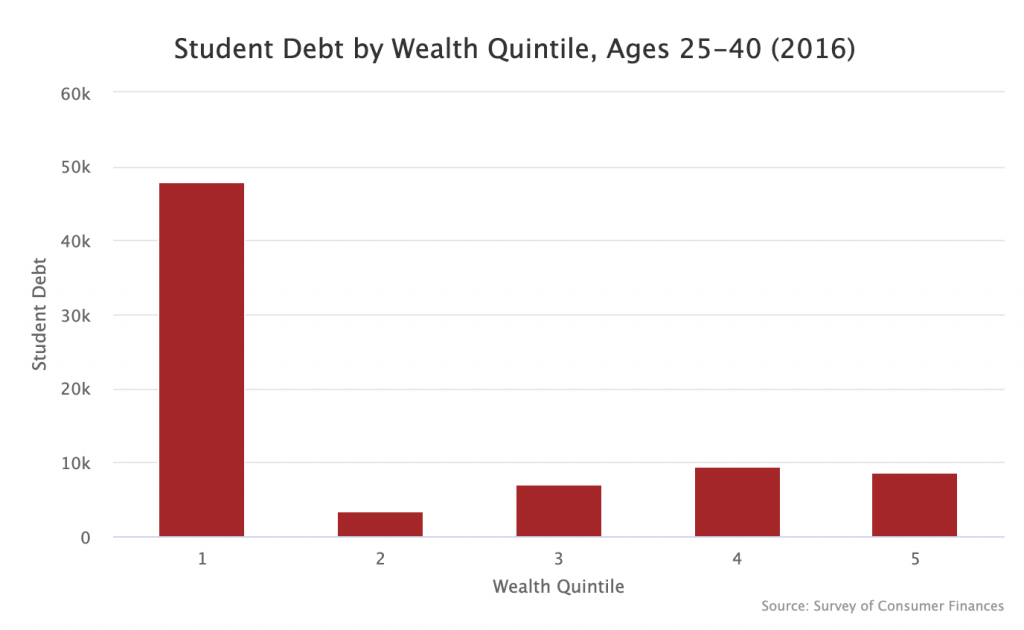
Student Debt by Wealth Quintile
The picture looks a lot different when you look at wealth. The bottom fifth of young families (measured by wealth) have an average student debt of $48,975. The next highest quintile — families between the 60th and 80th percentiles — have an average student debt of $9,517. Since student debt is a balance sheet thing (assets and liabilities), I suspect that it is this distribution that ordinary people feel, rightly or wrongly.
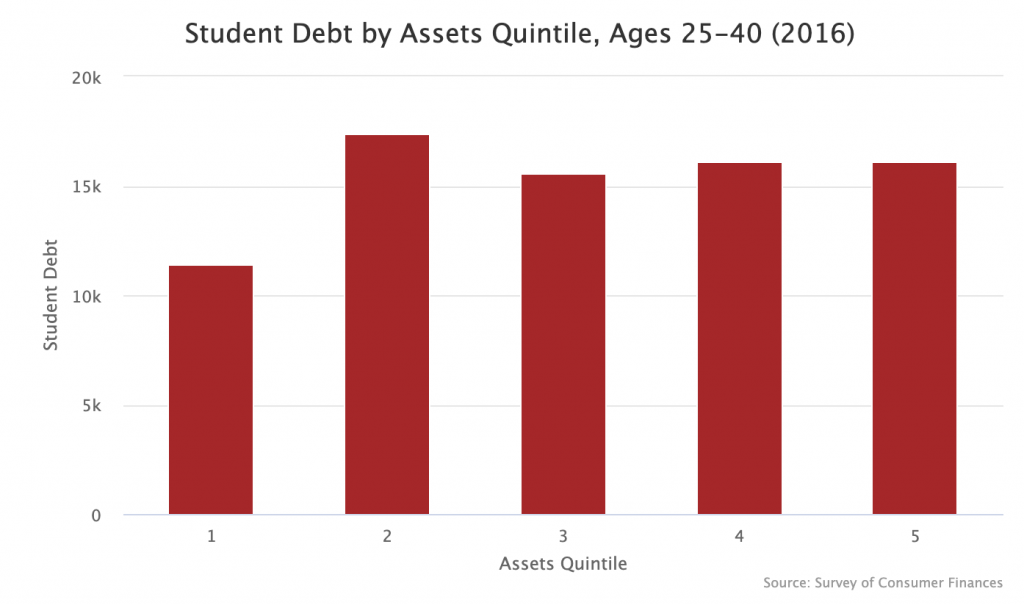
Student Debt by Assets Quintile
It is almost true by definition that student debt levels will be concentrated on the bottom of the wealth distribution since having a high student debt pushes you down the wealth distribution. Thus it might be helpful to also look at student debt levels broken down by assets quintile. The assets quintiles count everything the families own (homes, retirement accounts, etc.) but does not count everything they owe (mortgages, student debt, etc.).
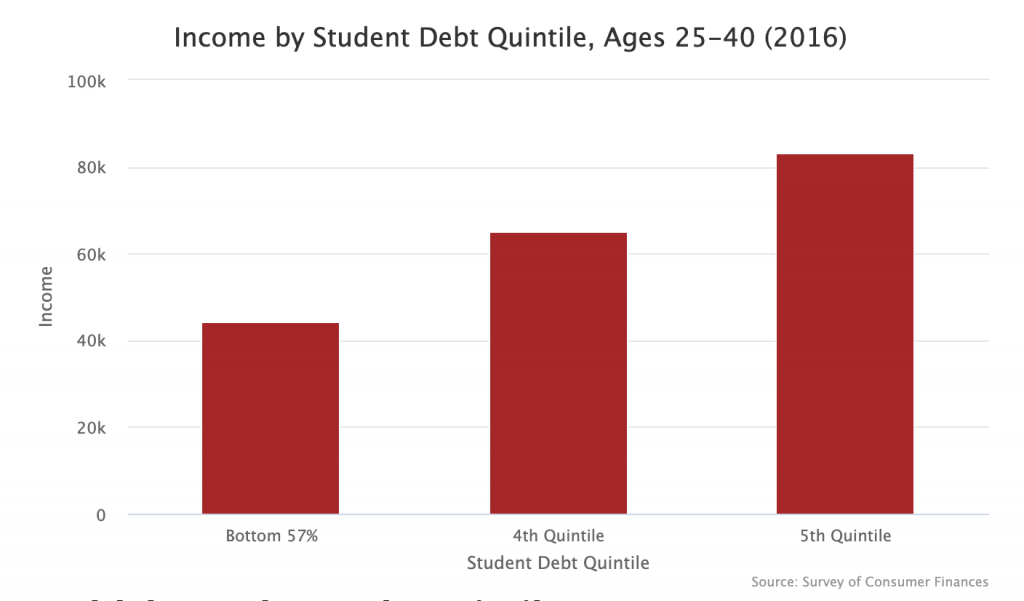
Income by Student Debt Quintile
In addition to looking at student debt by income quintile, it can also be helpful to flip the axes and see what the average income is in each student debt quintile. One difficulty of doing this is that only 43 percent of families with heads between the ages of 25 and 40 have outstanding student loan balances. So for these purposes, I lump together the 57 percent without student debt into one bucket and then cut the 43 percent with student debt into two buckets and count them as the 4th and 5th quintiles.
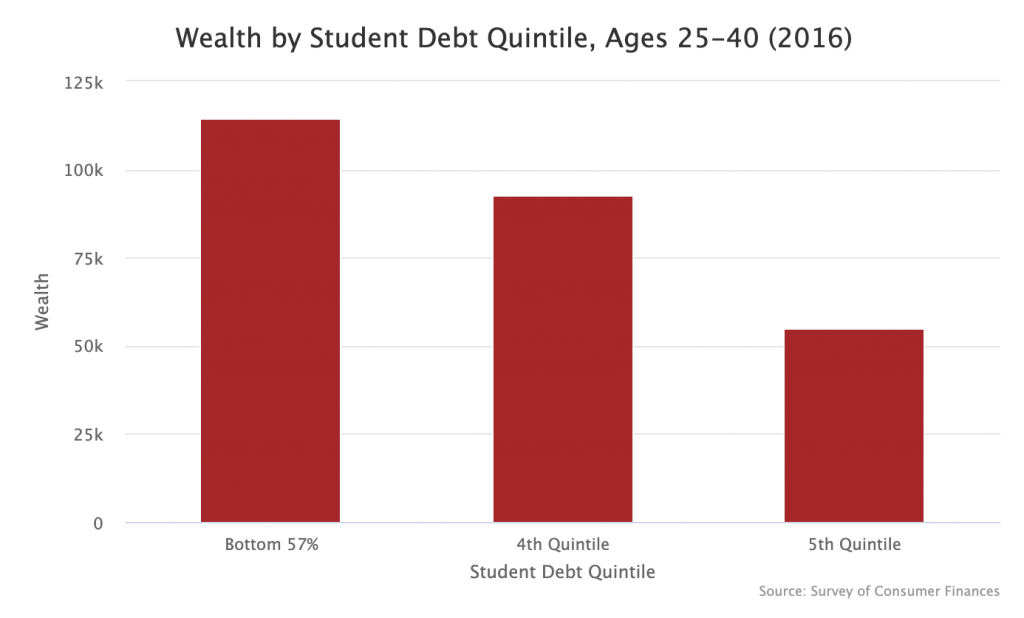
Wealth by Student Debt Quintile
Flipping the axes on the student debt by wealth graph in a similar manner gives you the following.
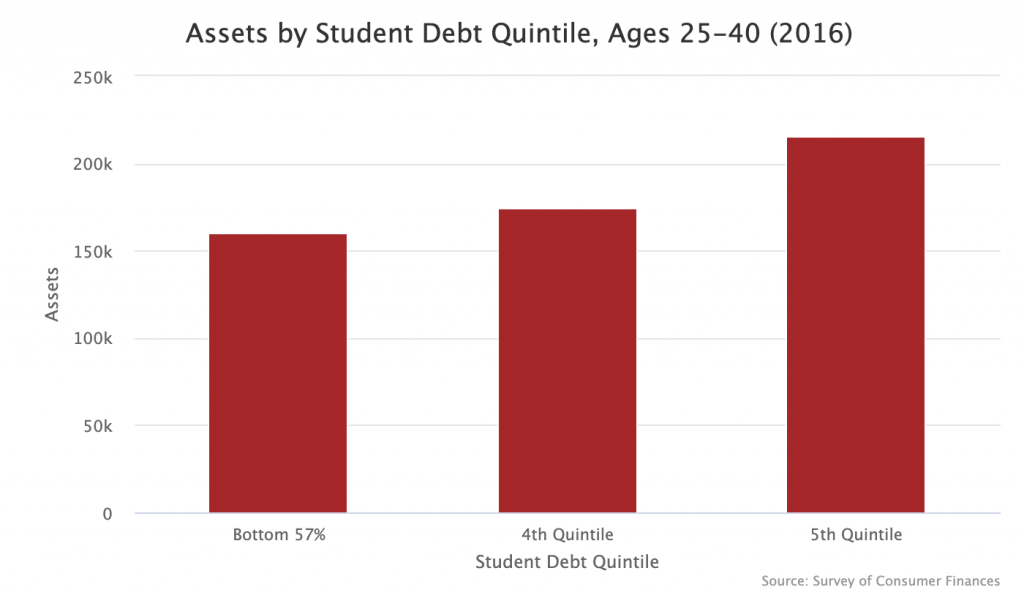
Assets by Student Debt Quintile
Finally here is assets by student debt quintile.