
The uneven distribution of nonworkers across families is one of the largest drivers of inequality in American life. Unfortunately, this fact gets relatively little direct attention in our discussions about the economy. This lack of attention then seems to cause policy writers to put forward misguided policy proposals that double-down on things like the Earned Income Tax Credit rather than put forward a normal welfare state agenda like the Family Fun Pack.
To help understand how unevenly nonworkers are distributed across families, I produced the following graphs based on the latest CPS ASEC data.
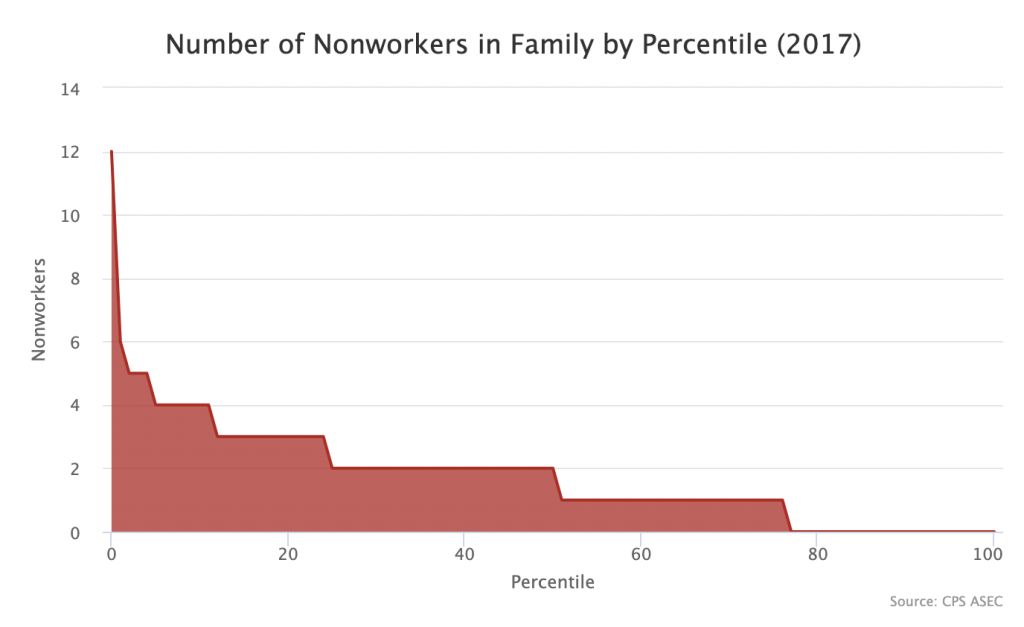
Nonworkers
First, we have the number of nonworkers in each person's family by percentile. It goes from most nonworkers (left) to least nonworkers (right). There is at least one family that has 12 nonworkers in it. Around 24 percent of individuals live in families with 3 or more nonworkers in them. On the other end of things, around 24 percent of individuals live in families with 0 nonworkers them.
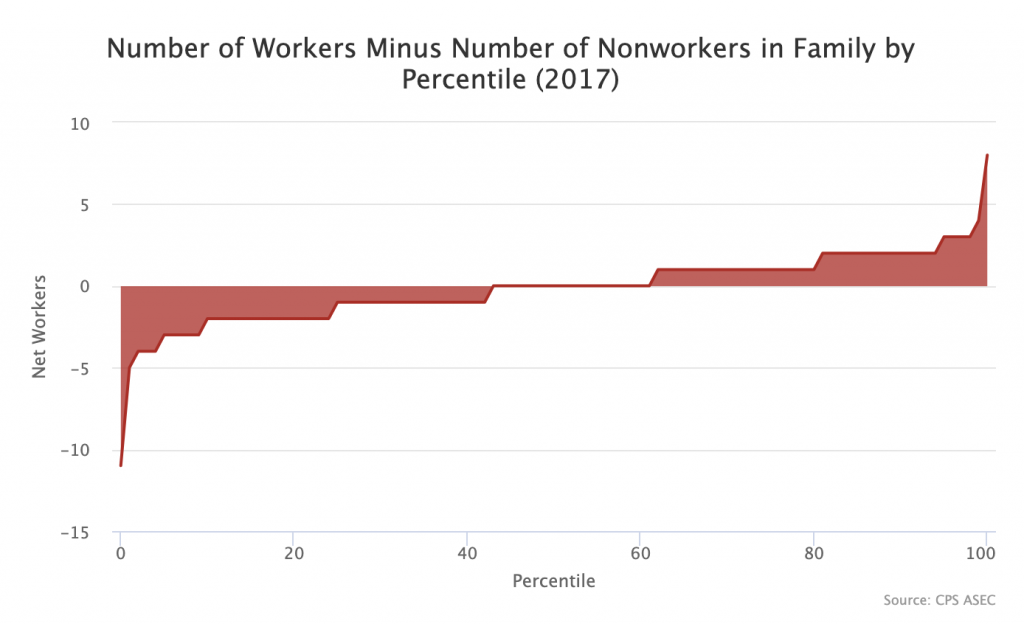
Net Workers
Second, we have the number of workers minus the number of nonworkers in each person's family by percentile. This gives a better sense than the first graph of how unevenly distributed the burden of nonworkers is. It's not just that some families have more nonworkers than others. It's also that the balance between workers and nonworkers in each family is very different.
On one end of things, we have a family that has 11 more nonworkers than they have workers. On the other end, we have a family that has 8 more workers than they have nonworkers. Around the median, individuals live in families that have an equal number of workers and nonworkers, as is true of society as a whole. But as you migrate out from the median, the story is very different, with some families having far more workers than nonworkers and others having far more nonworkers than workers.
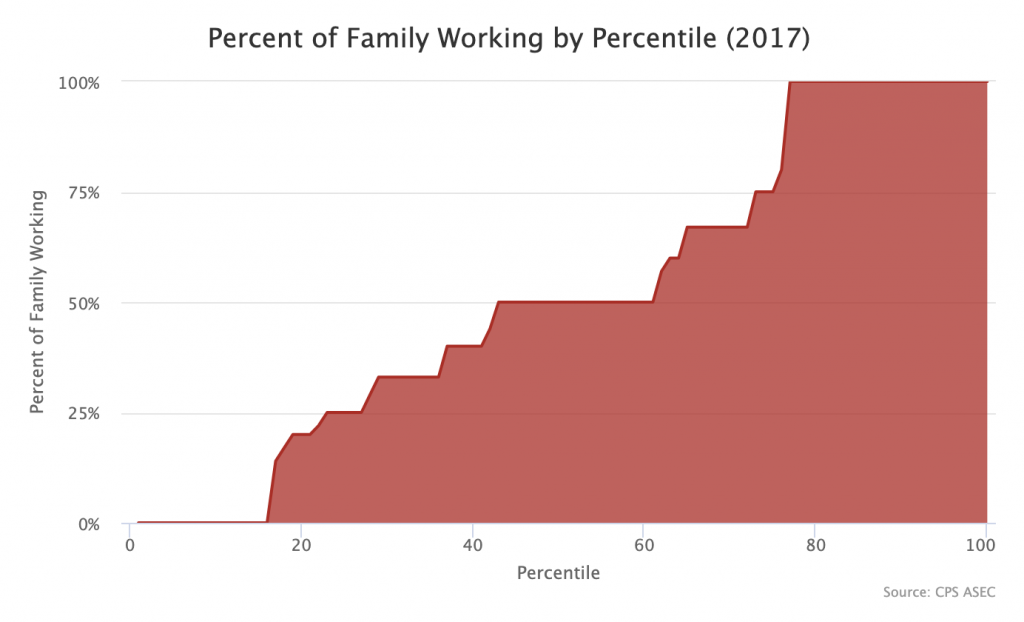
Nonworker Share
Third, we have the percentage of family members who are working by percentile. This is better than the first and second graph in driving home how unequal the dependency burden is.
Around 15 percent of individuals live in families where 0 percent of the family works. These are going to mostly be retired people and disabled people obviously. On the flip side, around 24 percent of individuals live in families where 100 percent of the family works. As in the prior graph, the median individual lives in a family where half of the members work and half of the members don't work.
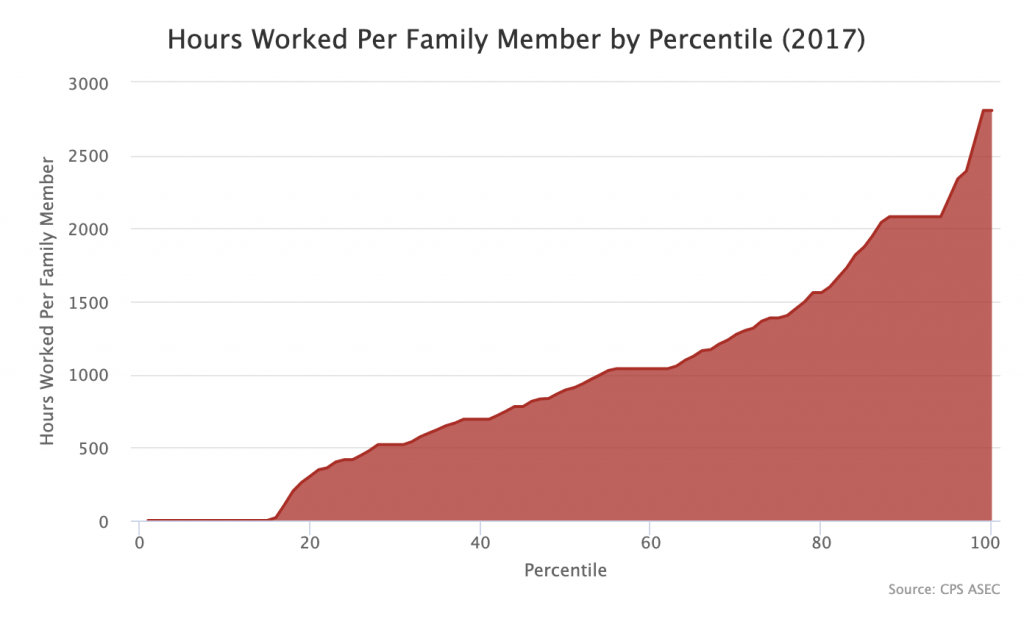
Hours Worked
Lastly, we have hours worked per family member. To understand what this means, consider a five-person family where three people do not work at all, one person worked 2080 hours, and one person worked 1040 hours. This would show up as (2080 + 1040) / 5 = 624. That is how many hours that family worked per family member.
This graph is thus a slightly more fine-grained version of the prior one. Whereas the prior one counts all of the workers in the family and divides by the number of people in the family, this one counts all the hours worked in the family and divides by the number of people in the family.
Conclusion
What this all shows is that you cannot rely upon wages or benefits paid to workers to achieve any kind of equality in society. Compressing the wage structure so that the gap between the lowest-paid worker and highest-paid worker is much smaller, shifting market income away from capital and towards labor, and providing earnings-related benefits like the EITC are simply not going to cut it in a world where workers live in very differently-sized families and therefore have to stretch their pay and benefits across very different numbers of dependents.
Thus, the solution to inequality — both poverty and horizontal inequality between similar workers — has to include a universal welfare state that provides social benefits to all nonworkers. This is key not just for nonworkers themselves, but also for the workers that live with them. Unless we shift resources away from the right side of the above graphs to the left side of the above graphs, we will never have an egalitarian society.