
Rashida Tlaib released her LIFT+ proposal recently, which would annually provide $3,000 to single tax filers and $6,000 to joint tax filers up to a certain income level. Tlaib's proposal is a play on Kamala Harris's LIFT proposal, which provides $3,000 to $6,000 to single and joint tax filers except for those with very low or no earnings. Thus, LIFT+ is just LIFT plus the poor.
Because LIFT+ does not phase in based on earnings, it provides income support to virtually every poor person and is therefore much more effective at reducing poverty than LIFT is. Below are three poverty measurements that compare the two programs based on my own calculations of the 2017 CPS ASEC. In all cases, poverty is defined by the supplemental poverty metric (SPM).
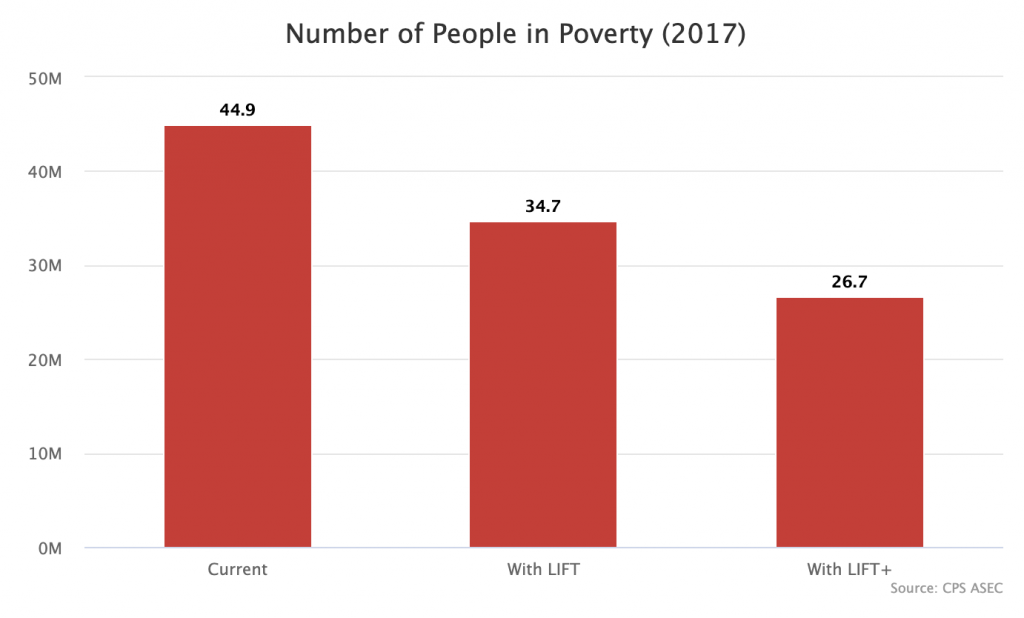
Headcount Poverty
In 2017, there were 44.9 million people with incomes below the poverty line. If Harris's LIFT credit had been around, that number would have been 34.7 million. If Tlaib's LIFT+ credit was around, it would have been 26.7 million.
Here is the same graph but with poverty rates instead of poverty levels.
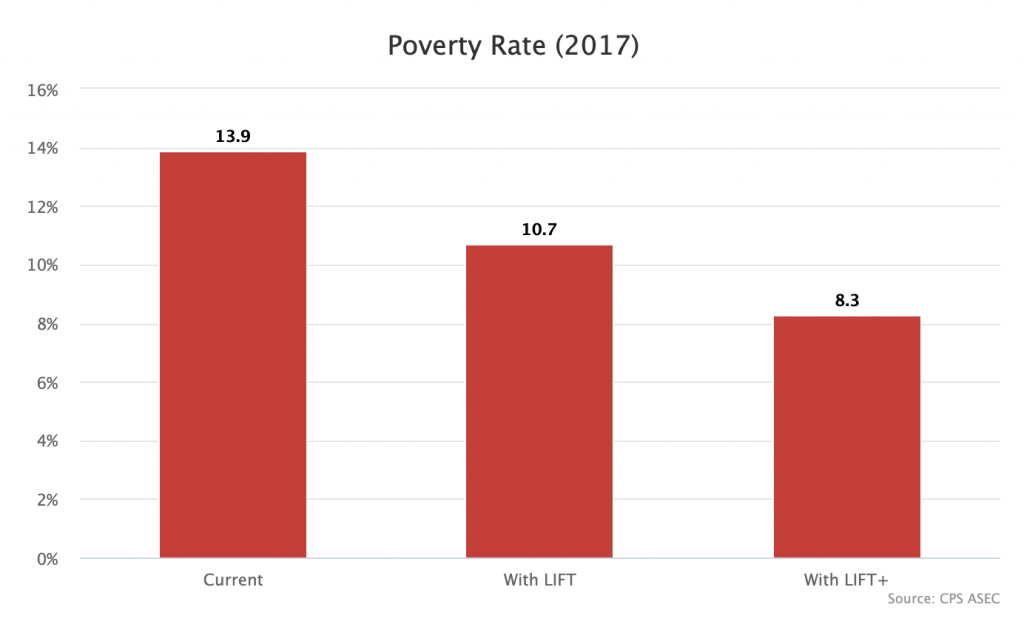
When it comes to reducing headcount poverty, LIFT+ is nearly twice as effective as LIFT.
Income Distribution of Bottom Quintile
The headcount poverty measure greatly understates how much better LIFT+ is than LIFT because it only counts the people who are moved over the poverty line by the program. This undersells the effect of LIFT+ because the chief novelty of LIFT+ is that it provides income support to the very poor who are so far below the poverty line that even $3,000 or $6,000 will not enough to move them over it.
The following graph shows the income distribution of the bottom 20 percent of individuals. The current line shows what it actually was in 2017. The LIFT and LIFT+ lines show what it would have been if the programs were enacted. Each individual's income is given as a percent of the poverty line (vertical axis). This bakes in differences in cost of living and family size and really shows how the two programs carve into poverty itself.
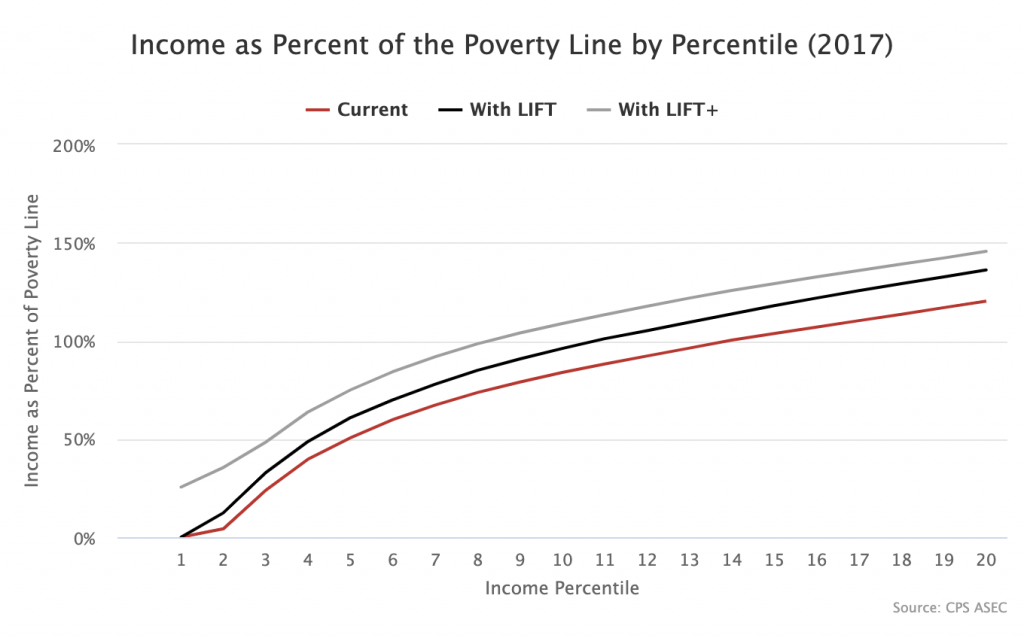
The LIFT+ credit boosts incomes by about 25 percent of the poverty line at every percentile on the above graph. Because it excludes the very poor and phases in, the LIFT credit boosts bottom incomes by zero and then boosts the other incomes by around 8 to 16 percent of the poverty line (with the boost increasing for richer individuals).
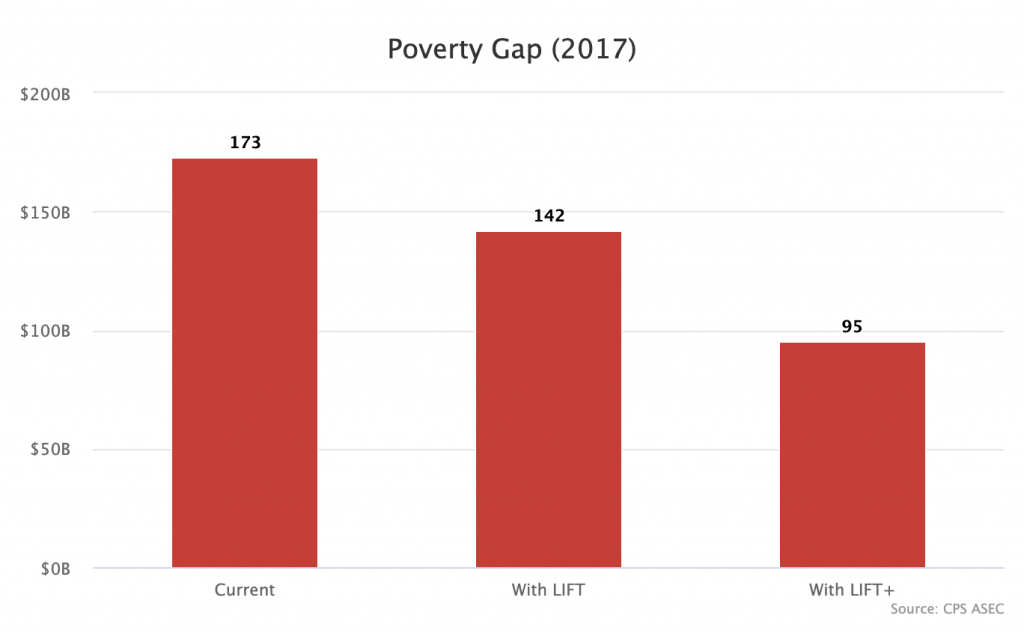
Poverty Gap
The final measure, which is also the best measure, is the poverty gap. The way the poverty gap works is I add up, not just how many people are in poverty, but how far away they collectively are below the poverty line.
In 2017, the poverty gap so defined was $173 billion. Under LIFT, it would have been $142 billion. Under LIFT+, it would have been $95 billion. Thus, LIFT+ is nearly two-and-a-half times as effective as LIFT at cutting poverty. Another way of putting it is to say that LIFT+ cuts poverty by 45 percent. LIFT only cuts it by 18 percent.
Going forward, we need more programs like LIFT+ that do not phase in based on how much individuals earn. This is the only way to really make a huge dent in poverty.
Technical details
I used the 2017 CPS ASEC file and the SPM research file for the above calculations. Poverty is defined by the supplemental poverty measure. For Harris's LIFT credit, I take the earnings of each tax unit and then apply the LIFT phase-in formula (100% phase in for first $3,000 for individuals and first $6,000 for couples). For Tlaib's LIFT+ credit, I add $3,000 to single tax filers and $6,000 to joint tax filers. I also assume adults who currently do not file taxes (e.g. because their incomes are too low or because they are claimed as dependent) will file taxes in order to receive the $3,000 credit. Families who currently have negative incomes had their incomes changed to $0 for these purposes.