
The Heartland Institute's Justin Haskins put out a paper purporting to be a distributional analysis of Medicare for All. The paper is one of the shoddiest think tank reports I've ever seen, raising the usual question about conservative think tank output: intentionally deceptive or merely incompetent? I will not answer that question in this post, but I will break down just how bad Haskins's paper is.
How To Do An M4A Distributional Analysis
The goal of a distributional analysis is to determine how much better off (or worse off) people at different income levels will be after we transition to a Medicare for All system. To conduct such an analysis, you need to do three things:
- Add up all the money spent on health care in our current system ($4.562 trillion in 2022) and allocate that money to each household based on how much they personally pay. This includes how much they pay for Medicaid taxes, Medicare taxes, premiums, foregone wages (so employers can pay premiums and Medicare taxes), and out of pocket spending.
- Add up all the money that would be spent on health care under Medicare for All ($4.469 trillion in 2022 according to Blahous) and allocate that money to each household based on how much they personally pay, which in an M4A system is just Medicare taxes and foregone wages (so employers can pay Medicare taxes).
- Compare the allocation in (1) to the allocation in (2) to see how things have changed for households at different income levels.
This is a conceptually simple exercise, but it is very difficult to do well because our current health care system is so complicated and because Medicare for All advocates have not settled on a financing plan yet, choosing instead to offer up various financing options. To really do this sort of analysis correctly, you need a couple of difficult-to-construct microsimulation models and a clear financing plan to plug into those models.
The last time these conditions were satisfied was in 2018 when the Rand Institute's Jody Liu used the COMPARE and PADSIM models to do a distributional analysis of a single payer plan for New York State. Liu found that the plan, which was fully financed, reduced health care costs for families with incomes below 1,000 percent of the poverty line ($133,500 for a single individual and $276,100 for a family of four) while increasing them for families with incomes above that level.
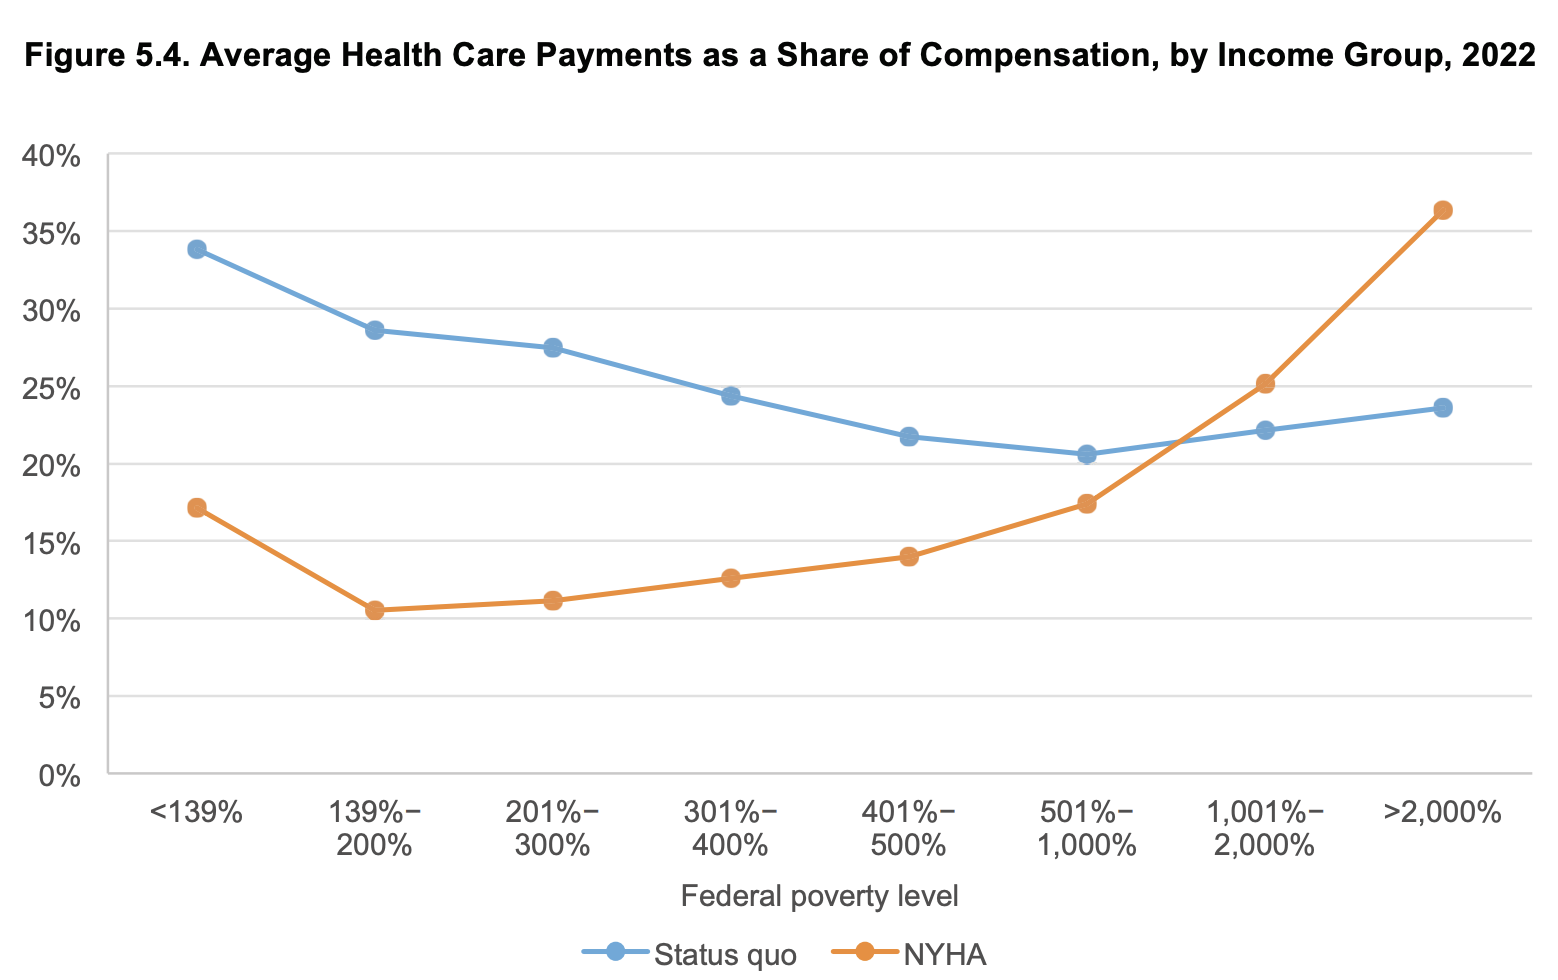
Although Medicare for All advocates have left the precise details of the financing open for the time being, this distributional change from Liu is clearly what those advocates intend to achieve: lowering overall health expenditures a bit and redistributing those expenditures up the income ladder so that the vast majority of Americans see their health care costs go down at the same time that their health insurance improves.
How Haskins Does M4A Distributional Analysis
The Haskins approach to doing a M4A distribution analysis is much different. It goes like this:
- Take Blahous's estimate of the added federal budget cost of M4A ($2.535 trillion in 2022) and subtract from it the amount of money Sanders's 7.5 percent employer-side payroll tax would raise ($400 billion in 2022) to get $2.135 trillion of remaining federal spending that needs to be financed.
- Take that $2.135 trillion and allocate it to various income groups based on their current share of the federal income tax. For example, households with incomes between $30,000 and $40,000 pay 2.16 percent of federal income taxes and are therefore allocated 2.16 percent of the $2.135 trillion bill ($31.7 billion). That $31.7 billion is then divided by the number of tax units in that income band (15 million) to conclude that households in that income band will pay $2,100 more in tax.
- For every income group, compare the figure from (2) with the average employee premium for employer-sponsored insurance, which, in 2022, is $1,965 for a single plan and $6,752 for a family plan.
This might sound complicated and sophisticated, but it's basically just 20 minutes of spreadsheet work, which can be summed up in a single graph:
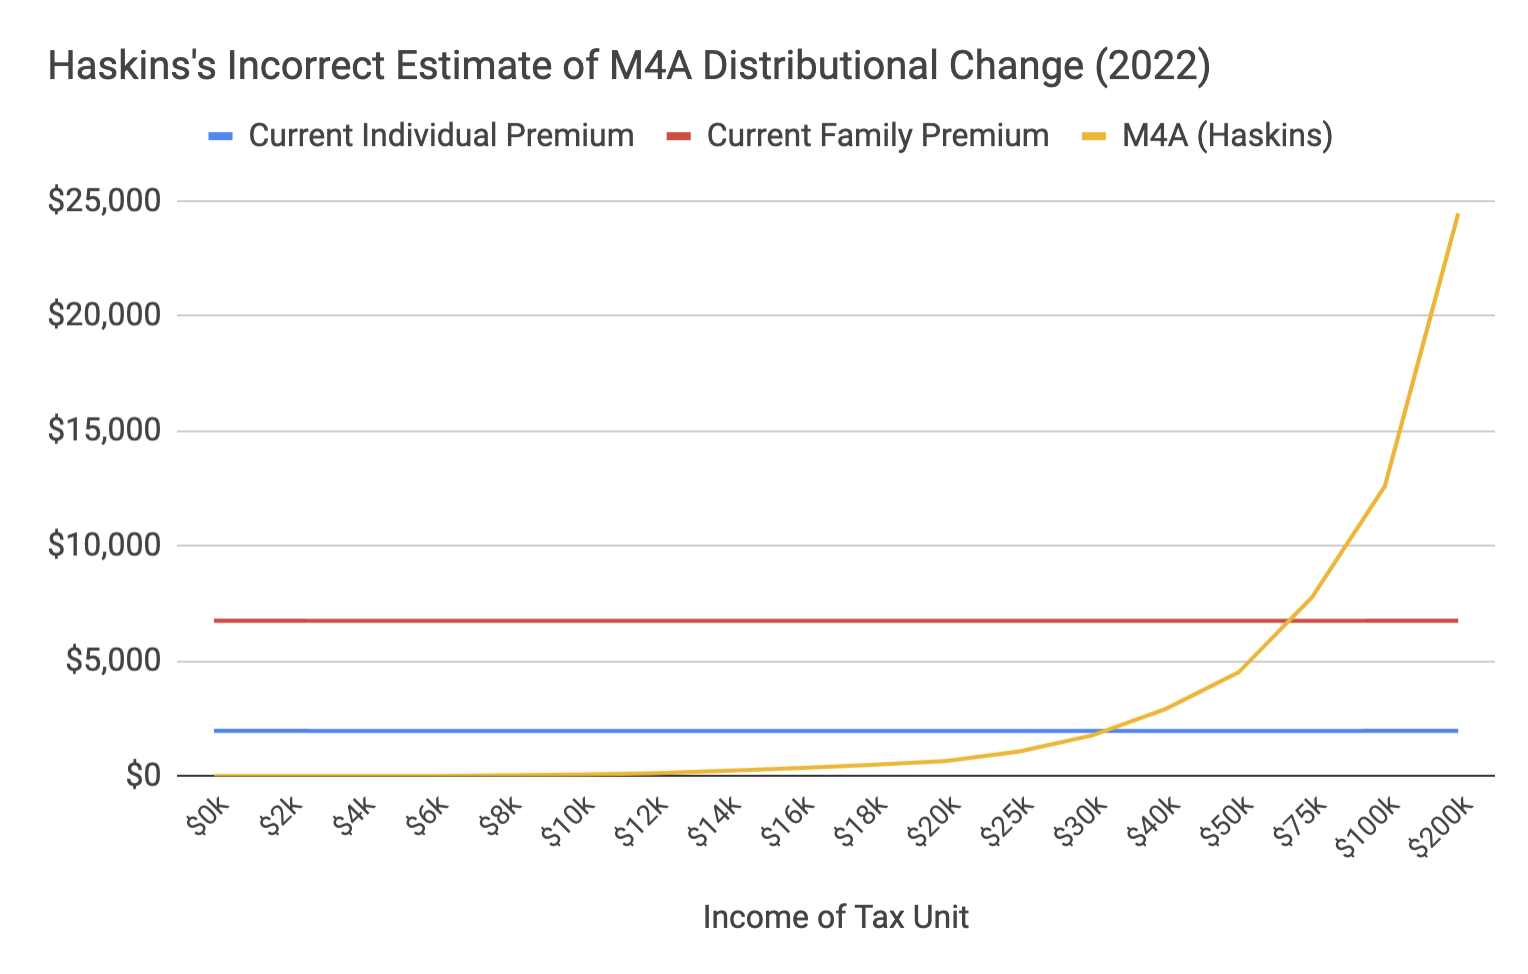
When the yellow line overtakes the blue or red line, that is supposed to be when M4A costs households more than their current health care. So while the Rand Institute says the breakeven point is around 1,000 percent of the poverty line, Haskins wants us to believe it is around 300 percent.
Haskins Ignores At Least $1.4 trillion of Savings
The reason Haskins is so far off the mark is because he fails to allocate at least $1.4 trillion of savings that will be realized by the transition to Medicare for All. His analysis essentially assumes that new federal health expenditures in M4A will only replace employee premiums. But in fact, they replace employee premiums, employer premiums, out-of-pocket expenses, state Medicaid taxes, and state taxes for other health spending (mainly CHIP and phase-down payments).
Since this spending is no longer going to occur, the money going to it has to be allocated to the tax units. By not allocating it, Haskins essentially disappears $1.4 trillion from the 2022 economy and then triumphantly declares that people have much less money than before.
Here is a conservative accounting of some of the savings that Haskins fails to allocate back to households, based on the CMS projections for 2022:
- State Medicaid spending — $289 billion.
- Half of other state health programs — $100 billion (50 percent of $200 billion).
- Employer premium contributions beyond new payroll tax — $559 billion (Employers will pay $959 billion to premiums in 2022. I subtract $400 billion because Haskins has already counted that as going to the government through the new payroll tax.)
- Household out-of-pocket expenses — $458 billion.
Add it up and you get $1.4 trillion.
To repeat: once Medicare for All is enacted, all of this spending will go away. Thus the dollars have to be allocated back to households as money that they save. Failing to do so just vanishes the money into thin air and counts the new taxes as lost money without counting the spending they replace as saved money.
Fixing Haskins's Mistake
To see what happens when you allocate this money back to households while keeping everything else about Haskins's approach the same, I allocated the money back to households in the following manner:
- Employer premium contributions beyond new payroll tax: allocate equally to each tax unit on the assumption that it functions like a per-capita (head) tax. This is exactly how Haskins treats employee premiums.
- Household out-of-pocket expenses: allocate equally to each tax unit on the assumption that all income bands have similar out of pocket expenses. In reality, lower-income people tend to have higher out-of-pocket expenses.
- State Medicaid and other state health spending: allocate to each unit in proportion to their share of pretax income on the assumption that it functions like a flat tax. In reality, state taxes are regressive not flat.
When we make only these (conservatively-estimated) modifications to Haskins's spreadsheet, we get a very different result.
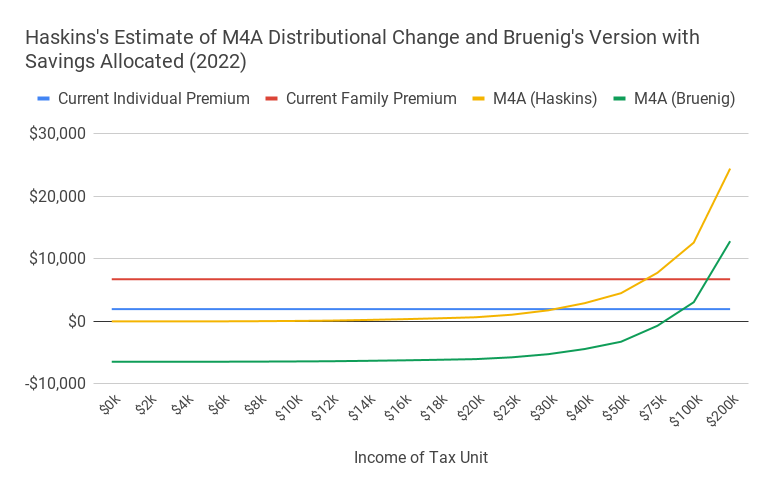
With the $1.4 trillion allocated back to households, the breakeven point for singles is around $90,000 while the breakeven point for families is around $140,000. Meanwhile middle class families see dramatically higher savings than Haskins lets on. Under Haskins's approach, a family making around $50,000 saves about $2,200. But when you reallocate the saved money like I do here, it shoots to $10,000.
Although vanishing all these savings into some kind of economic black hole is Haskins's most spectacular error, his decision to allocate the new taxes in a way that is proportional to the distribution of the current federal income tax burden is also indefensible. In the same document where Haskins gets the 7.5 percent employer payroll tax that he uses in his analysis, Sanders also proposes increasing the estate tax, imposing a wealth tax, treating capital gains and dividends as ordinary income, capping tax deductions for high-income households, and increasing marginal tax rates for incomes over $250,000. In other words, he has clearly indicated that he will not raise the revenue in a way that is proportional to the current income tax burden, but instead in a much more progressive manner.
As a technical matter, it is not particularly difficult to design a Medicare for All financing regime that ensures that the bottom 80 percent of households wind up saving money in the process. You just keep overall national health expenditures the same as they are now (or slightly lower) and then redistribute those expenditures up the income ladder. This is what every Medicare for All plan proposes and what credible models show that they will do.
Correction: After publication, Haskins informed the author that, although Blahous does not detail this in his paper, Blahous’s estimate of the net federal budgetary cost of M4A includes within it $200 billion of state Medicaid savings that he assumes will be provided to the federal government through maintenance-of-effort payments. This means Haskins’s analysis ignores $1.2 trillion of savings, not $1.4 trillion. This correction does not affect the general analysis.