
One of the big impediments to putting out a plan for financing Medicare for All is not so much that it is very difficult to come up with one, but rather that there are so many ways to do it that it is hard for any one particular idea to get consensus and therefore traction. I don’t have a solution to that problem unfortunately and, paradoxically, efforts to solve it by putting out my own ideas actually make the problem worse. But, nonetheless, I am going to lay out in this piece the way I would approach the M4A financing question.
Grouping Current Spending
The CMS frequently publishes national health expenditure (NHE) projections that estimate how much overall money will be spent on health care in the years to come. Policy analysts group this spending in all sorts of ways. None of the ways are incorrect, but some are more helpful than others when thinking about financing Medicare for All.
The most helpful grouping of current projected spending, in my view, is as follows (this is for year 2022):
-
- Employer Payments – $1.194 trillion. This includes employer contributions to private insurance premiums ($959 billion) and employer Medicare taxes ($235 billion). This includes contributions from all employers: private businesses, state governments, and the federal government.
-
- Household Payments – $1.239 trillion. This includes household contributions to private insurance premiums ($450 billion), household Medicare taxes and premiums ($331 billion), and household out-of-pocket spending ($458 billion).
-
- Federal Health Programs – $1.272 trillion. This includes Medicare, Medicaid, and other federal health programs. Crucially, this figure excludes the Medicare taxes and premiums contributed by employers and households. Those are counted in the Employer Payments and Household Payments above. So this figure is essentially federal health spending that is financed by general taxes.
-
- State Health Programs – $0.489 trillion. This includes Medicaid and other state health programs.
- Other Private – $0.308 trillion. This is philanthropy and the non-operating revenue and investment income of health provider establishments.
When you put it together, you get a total of $4.502 trillion, which are the projected national health expenditures for 2022. This figure is equal to 18.2 percent of GDP in 2022.
Matching the Spending
By grouping the spending this way, the question of how to finance M4A becomes a lot more straightforward.
The first thing you do is bring in existing spending on Federal Health Programs and State Health Programs, the latter through a maintenance of effort requirement. That gets you $1.761 trillion.
Then you can assume that Other Private ($0.308 trillion) remains the same, getting you to $2.069 trillion.
At this point, you want to bring in all of the federal government tax expenditures that go towards tax exclusions that would no longer exist under Medicare for All. Using the Treasury Department’s figures, this includes the tax exclusion for employer premiums, self-employed medical expenditures, health savings accounts, medical expense deductions, and the special Blue Cross/Blue Shield tax benefits. All together, in 2020, these exclusions total to $0.427 trillion, getting the running sum to $2.496 trillion.
Bringing in the tax expenditures like this essentially assumes, for the moment, that all of what employers currently spend on private premiums will flow through to workers as an increase in gross wages. If you are going to do this, then, to avoid double-counting, any employer-side taxes you impose to help fund Medicare for All must be assumed to reduce the (the now higher) gross wages, meaning that they will also reduce the revenue collected by other income and payroll taxes that are assessed on gross wages. The revenue estimate for the employer-side payroll tax I assess later in the piece is calculated in precisely this way.
This $2.496 trillion figure does not count the tax exclusion for employee contributions to employer-sponsored insurance premiums, even though these premiums are generally untaxed in the status quo. To get an estimate of this amount, we can take the JCT estimate of the income tax exclusion for cafeteria plans ($53 billion) and add to it the payroll tax exclusion amount by assuming the ratio of the payroll tax exclusion to income tax exclusion is the same for employee contributions as it is for employer contributions, meaning that the total tax expenditures for employee premiums is $88 billion. That brings the running tally to $2.584 trillion.
After you have brought all that money in, then you want to apply any NHE savings (or extra NHE costs) that result from moving to a Medicare For All system. The only somewhat credible efforts I have seen to estimate NHE savings under M4A come from Mercatus and PERI. Mercatus says NHE will be $33 billion lower (0.1% of GDP) in 2022 under M4A while PERI says it will be $385 billion lower (1.6% of GDP).
For the purposes of this post, I am going to assume PERI is correct, though this doesn’t really matter for what I am trying to do here. Adding their estimated NHE savings of $385 billion to the $2.584 trillion brought in above gets you to $2.969 trillion.
What I have done so far is the relatively easy part, both mathematically and as a policy matter. This gets us 66 percent of the way to the $4.502 trillion total we are trying to reach, meaning there is another $1.533 trillion to go. The remaining money will need to come from the Household Payments and Employer Payments buckets, which together already spend $2.433 trillion in the status quo system.
Household Payments
Before dipping into the Household Payments bucket, it is important to talk about how Household Payments are currently distributed. One common claim repeated by pundits is that it is difficult to design a household M4A tax scheme that does not hurt the poor because the poor are currently covered by government health programs and therefore pay very little for health care. This claim is completely false.
In the below chart, I use the 2018 CPS ASEC to sort the population into money income deciles and then show what percent of each decile’s earnings go towards health payments (red line). I then replace those health payments with a hypothetical flat tax on earnings (black line). Health payments include household contributions to insurance premiums, out-of-pocket spending, and the 1.45 percent employee Medicare tax. This is an equivalent measure to the Household Payments bucket.
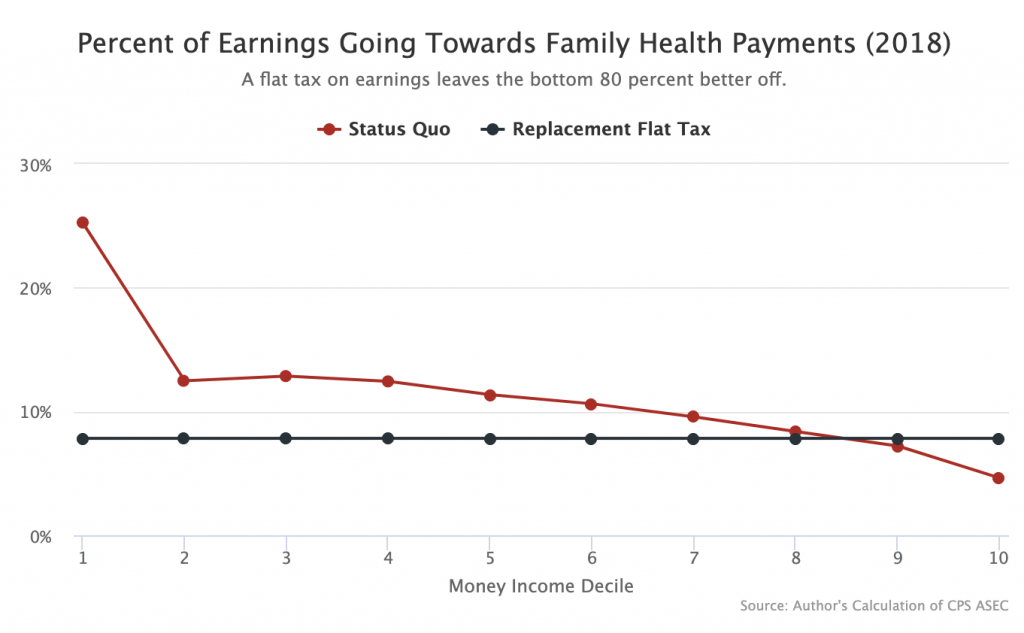
As the graph shows, replacing current Household Payments with an M4A flat tax on earnings (or “earnings-based premium”) would dramatically improve the lot of the poorest Americans while leaving the bottom 8 deciles better off. Even the 9th decile experiences only a very modest increase in health spending.
Pundits who claim that the bottom would be hurt by this transition are blatantly incorrect. Their error probably results from a generalized lack of understanding of how Medicaid actually works (or does not work) for poor people. In a given 12-month period, only 62 percent of people who are on Medicaid at the start of the period remain on the program continuously for the whole period and a whopping thirty percent come off the Medicaid rolls and into uninsurance.
To be clear, I am not necessarily advocating a flat tax here. I am only using it as a simple comparison to the current system to drive home the point that virtually any way of replacing Household Payments will mean significant savings for the middle and lower classes.
When it comes to actually replacing Household Payments, I think you want to do two things.
First, you want to apply your rich-people taxes. Here are some (all numbers for 2022 from JCT or CBO):
-
- Treat Capital Gains and Dividends as Ordinary Income – $137.5 billion.
-
- Eliminate Capital Gains Exclusion at Death – $44.6 billion.
-
- Eliminate Itemized Deductions – $80.9 billion.
- Financial Transactions Tax – $93.2 billion.
Together, these four changes bring in $356.2 billion, increasing the running tally of M4A financing to $3.325 trillion.
Second, you increase the tax rates for all of the federal income tax brackets by the necessary number of percentage points to get another $310 billion. The CBO says that increasing every federal income tax bracket by one percentage point raises $91.4 billion, but this number will be significantly higher if items one through three from the first step are implemented. Increasing all of the federal income tax brackets by 4 points should more than get the job done.
For distributive purposes, remember in all of this that the standard deduction exempts the first $12,000 of income for singles and $24,000 of income for couples from the federal income tax. Also remember that the 1.45 percent Medicare tax, which currently applies to all earnings, even those below the standard deduction, is going away.
Bringing in this $310 billion increases the running financing tally to $3.635 trillion. This approach to replacing Household Payments — a few rich-people taxes and increasing the federal tax brackets by 4 points — is clearly more progressive than the current system and is completely workable.
Employer Payments
The last thing left to do is restructure Employer Payments. These payments are currently $1.194 trillion, but we only need $867 billion to finish up the M4A financing.
The first thing you want to do in this bucket is simply bring in the existing Medicare taxes paid by employers. Those are equal to $235 billion, increasing the running financing tally to $3.870 trillion.
The second thing you want to do is increase the employer-side payroll tax for earnings above the Social Security payroll tax cap (currently $137,700) by 6.2 percentage points. This is the distributive equivalent of eliminating the payroll tax cap on the employer side. I weirdly cannot find an exact estimate for this, but CBO estimates of related proposals suggest $80 billion is a good ballpark estimate. Adding that to the financing tally brings us to $3.950 trillion.
The last thing you want to do is just increase the employer-side Medicare tax by the necessary number of percentage points to bring in the remainder of the bill, which is $552 billion. The CBO says a 1 percentage point increase in the employer-side Medicare tax gets you about $87.4 billion, suggesting that increasing the tax by 6.3 percentage points gets you about where you need to go.
As mentioned already above, these revenue estimates for the employer-side payroll taxes assumes all of the money for the taxes comes out of gross wages, which ensures that there is no double-counting of the tax expenditure savings.
Under this proposal, the net contributions of employers to the health care system declines by $327 billion in 2022. These savings should eventually pass through as higher wages, but in order to ensure they are passed through sooner rather than later, a Medicare for All bill should include a provision requiring employers to pass through all net savings (net savings = current health care premiums – new employer-side payroll taxes) to their employees on a per-employee basis immediately. This rule can be enforced like any other wage theft issue: private or DOL wage-and-hour lawsuits in which non-compliant employers are required to give up 3x what they failed to pass through.
Altogether, then, the employer-side payroll tax goes to 13.95 percent after the reform, which is still well below Sweden’s 31.42 percent employer-side payroll tax.
As with the Household Payments, it is important to remember here that overall Employer Payments are going down while also being distributed higher up the earnings ladder. If policymakers are worried that increasing the employer-side payroll tax by this much in one fell swoop would be too disruptive, then they can just phase it in over a few years.
Conclusion
As I noted in the introduction, this is not the only way to to finance M4A. But it is a way to do it and is a useful framework for thinking about how to do it in a way that is credible, workable, and distributively progressive. Bring in existing state and federal spending, replace existing household spending with more progressive taxes, and then replace existing employer spending with a top-loaded increase in the employer-side payroll tax. The precise rates needed to do this depend on what exactly you think the revenue number needs to be, but the basic structure of the approach works regardless of what that number is.
This piece has been tweaked multiple times as thoughts on how best to do this change.