
For non-White Americans, economic analysis centers on comparisons to White Americans. For the richest Black, Asian, and Hispanic folks, this single-minded focus makes sense. Excluding corporations, the only consistently inequitable economic relationships that remain for wealthy non-Whites may be those they have with their still wealthier White peers. But the same is not true for the lower classes within non-White groups. The Black poor are not only on unequal footing with wealthy Whites but with wealthy Blacks as well. The same goes for the poor among Hispanic and Asian Americans.
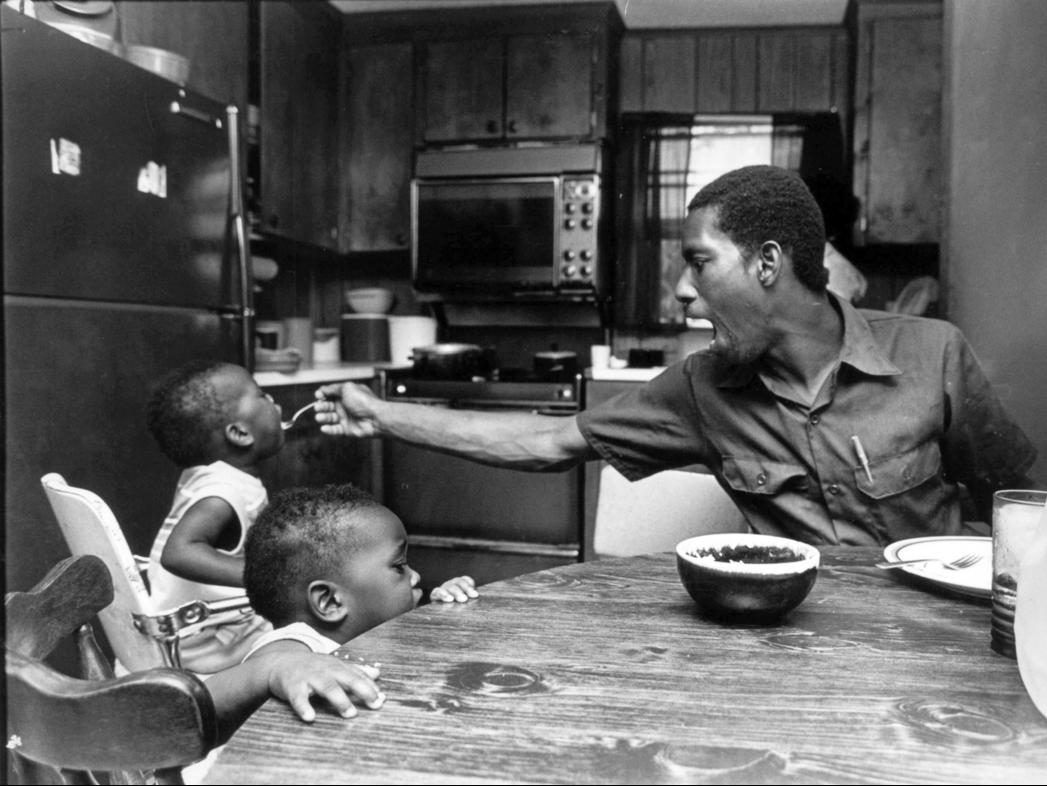
Income
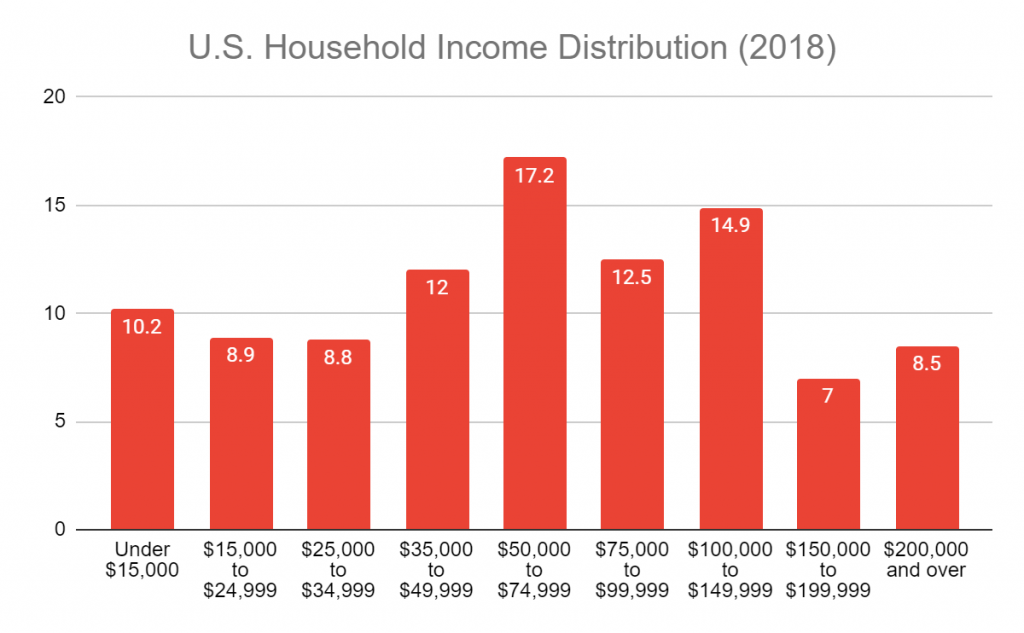
Source: U.S Census Bureau
In class terms, poor, low-income, and lower-class can be used to refer to the two leftmost income brackets depicted above; the same two brackets also represent the country’s lowest income quintile as of 2018 and map onto the federal poverty guidelines for families of average size. Each racial group has a unique distribution relative to these income brackets.

Source: U.S. Census Bureau (2018 Figures)
Ordinarily, in the discourse, the distributions of non-White groups are collapsed into single measures, primarily medians. When medians are applied in the absence of class analysis, which is the norm for non-Whites, they tend to give the impression that everyone within a racial category exists somewhere close to the median.
The following table compares incomes at the 10th percentile of the distribution to incomes at the 50th percentile (i.e. the median) in order to highlight the economic distance that currently separates the poor from the economic center of their respective racial groups.
| Race | 10th Percentile | 50th Percentile (Median) | P50 ÷ P10 |
| White | $15,132 | $48,613 | 3.2 |
| Black | $7,275 | $30,000 | 4.1 |
| Hispanic | $9,720 | $31,113 | 3.2 |
| Asian | $13,930 | $53,694 | 3.9 |
Source: American Community Survey (2018 Figures)
In every case, individuals at the 10th percentile earn less than a third of their race-wide median. For Blacks, the number is less than 25 percent. As a result, knowing the race-wide median provides minimal insight into the lives of the poor regardless of their race.
A similar and more dramatic comparison can be made using the ends of the income distribution.
| Race | 10th Percentile | 90th Percentile | P90 ÷ P10 |
| White | $15,132 | $121,410 | 8.0 |
| Black | $7,275 | $79,196 | 10.9 |
| Hispanic | $9,720 | $77,640 | 8.0 |
| Asian | $13,930 | $141,421 | 10.2 |
Source: American Community Survey (2018 Figures)
The 90th percentile Black person has more than 10 times the income of the 10th percentile Black person. Class disparity within the Asian community is similarly large. For Whites and Hispanics, the 90th percentile person has 8 times the income of the 10th percentile person.
In 2018, Pew Research Center released a report comparing the top and bottom 10 percent of income earners across racial and ethnic groups in 1970 and then again in 2016.
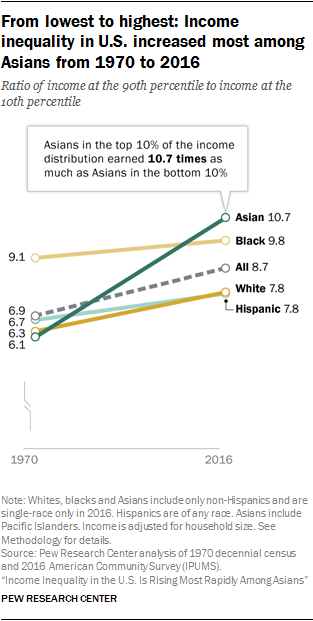
Source: Pew Research Center
Consistent with the 2018 figures, Pew found that the relative income disparity between the top and bottom 10 percent is excessive across the board, but it is particularly acute for Black and Asian Americans. In 1970, the 90th percentile of Black households earned 9x as much as the 10th percentile. By 2016, Pew found that the 90th percentile of Black households now earned nearly 10x as much as the 10th percentile. Only Asian Americans — who had been the most “equal” in 1970 — managed to surpass Black Americans in terms of in-group income inequality, though by 2018, Blacks had inched ahead of Asians once again.
Wealth
Income inequality left unabated over an extended period of time tends to produce even larger disparities with regard to wealth. Consider the following graph from a 2015 report by economists William Darity Jr. and Darrick Hamilton.
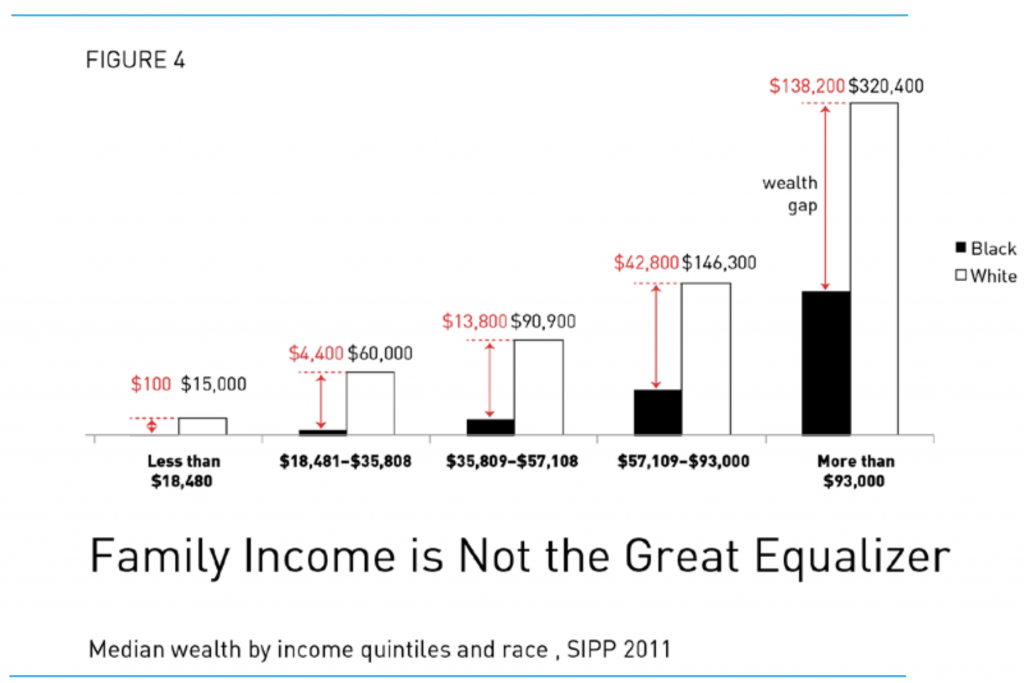
Source: Umbrellas Don’t Make it Rain
Unlike standard depictions of race-wide medians, here Black and White Americans have been separated into income quintiles. For the authors, the purpose of the graph is to show how wide the wealth gap between Black and White Americans is. As suggested in the preamble, I think an equally warranted use of this information is to compare individual classes within racial groups, something which the authors choose not to do.
The table below uses the figures provided by Darity and Hamilton to compare the median wealth of Black families at each income quintile to the race-wide Black median provided in the same report. Note that the authors were using figures from 2011.
| Black Family Income Quintiles | Black Family Median by Income Quintile | Race-Wide Median (2011) | Family Median ÷ Race-Wide Median |
| Over $93,000 | $138,200 | $7,113 | 19.4 |
| $57,109 - $93,000 | $42,800 | $7,113 | 6 |
| $35,809 - $57,108 | $13,800 | $7,113 | 1.9 |
| $18,481 - $35,808 | $4,400 | $7,113 | 0.6 |
| $0 - $18,480 | $100 | $7,113 | 0.015 |
Source: Umbrellas Don’t Make it Rain
Again, the race-wide median fails to accurately portray the economic experiences of Black Americans in different classes. The median wealth of the Black poor equates to just 1.5 percent of the race-wide median. At the other end of the spectrum, the Black upper-class possesses a median wealth 19x greater than the race-wide median. If we compare the top and bottom, we find that the Black upper-class has 1382x as much wealth as the Black poor. Though staggering enough in a vacuum, the difference appears worse when considered alongside more popularly discussed disparities.
| White Median ÷ Black Median | $111,740 ÷ $7,113 | Racial Wealth Gap = 15.7 |
| White Upper-Class Median ÷ White Lower-Class Median | $320,400 ÷ $15,000 | White Upper/Lower Gap = 21.3 |
| Black Upper-Class Median ÷ Black Lower-Class Median | $138,200 ÷ $100 | Black Upper/Lower Gap = 1382 |
Source: Umbrellas Don’t Make it Rain
Mobility
As with White Americans, class position over the last fifty years has unfortunately become semi-permanent, something handed down from parent to child. In 2016, Harvard economist Raj Chetty observed that only about half of children born after 1980 outearned their parents as adults, even when looking only at absolute earnings not relative earnings.
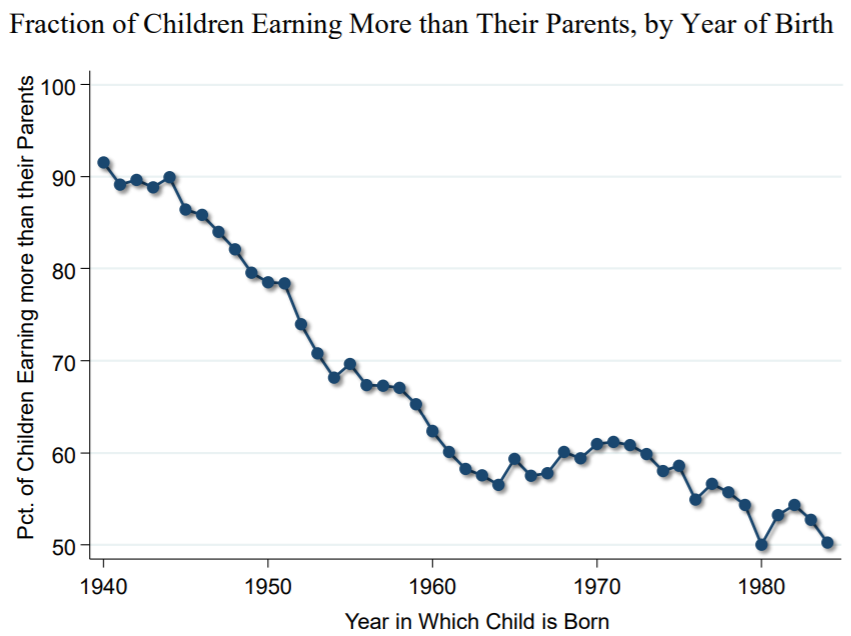
Source: The Fading American Dream: Trends in Absolute Income Mobility Since 1940
Chetty followed up with another study examining relative mobility rates for 20 million children born between 1978-1983, separated by race and ethnicity this time.

Source: Race and Economic Opportunity in the United States: An Intergenerational Perspective
The New York Times hosts a mobility calculator based on Chetty’s findings. For White, Hispanic, and Asian children born into the bottom quintile, between 40 to 60 percent are expected to remain in the poorest or second poorest income bracket as adults. Among Black and American Indian children, upwards of 70 percent are expected to remain in the two poorest income brackets.
To say that poor children remain poor as adults is to say that they will never gain middle- or upper- class occupations (if they did, they would cease to be poor). Class analysis emphasizes that generations of impoverished Black, Hispanic, American Indian, and Asian Americans have been excluded from not just the White halls of power but the non-White halls as well.