
I have been monitoring the information trickling out about the effect of dramatically slashing unemployment benefits in 26 states. My first post used the Census Pulse Survey to show that employment did not grow faster (indeed it grew slower) in the 12 states that cut UI benefits in early June. My second post reported on a study using bank transaction data that showed that individuals who were on UI in April became a lot poorer in states where UI was cut but only very negligibly increased their employment.
Payroll Growth
In this post, I look at the BLS state payrolls data, which was released late last week. For this analysis, I break states into four categories: the 12 states that cut UI between June 12 and June 19 (Early June), the 13 states that cut UI between June 26 and July 3 (Late June/Early July), the 1 state that cut UI on July 31 (Late July), and the remaining 24 states that are scheduled to cut UI on September 6 (Early Sept).
From there, I looked to see how payroll levels changed in each group relative to May of this year, the month before UI cuts began. If these cuts were juicing employment, you would expect to see payrolls increasing the most in the Early June states and the least in the Early Sept states, with the Late June/Early July and Late July states somewhere in between.
Instead, we see this.

The states that cut benefits the earliest had the lowest payroll growth among the four groups. The states that cut benefits in late June and early July led the pack, but the states that are scheduled to cut benefits in early September are only a slight tick behind them.
Overall, the states that cut benefits during or before the survey period saw their payrolls grow by 1.14 percent between May and July. The states that did not cut benefits during this period saw their payrolls grow by 1.09 percent. This 0.05 percentage point difference is not significant.
In the next graph I break out the performance of each individual state while still grouping them by color into the four categories discussed above.

The three states with the strongest payroll growth — North Carolina, Vermont, and Hawaii — are all states that have not cut unemployment benefits yet. Below that level, it's obviously impossible to spot any kind of consistent connection between UI cuts and payroll growth.
Job Rationing
The lack of any aggregate increase in job growth in the states that cut UI should be surprising at first. These were extreme cuts that threw half the people off the UI rolls in one fell swoop while cutting the incomes of those remaining on the rolls by $300 per week ($15,600 per year). Surely, it seems, at least some people who saw their benefits cut became so desperate that they managed to find a job that they would not have otherwise gotten if they were still receiving benefits. So why do we see no payroll growth?
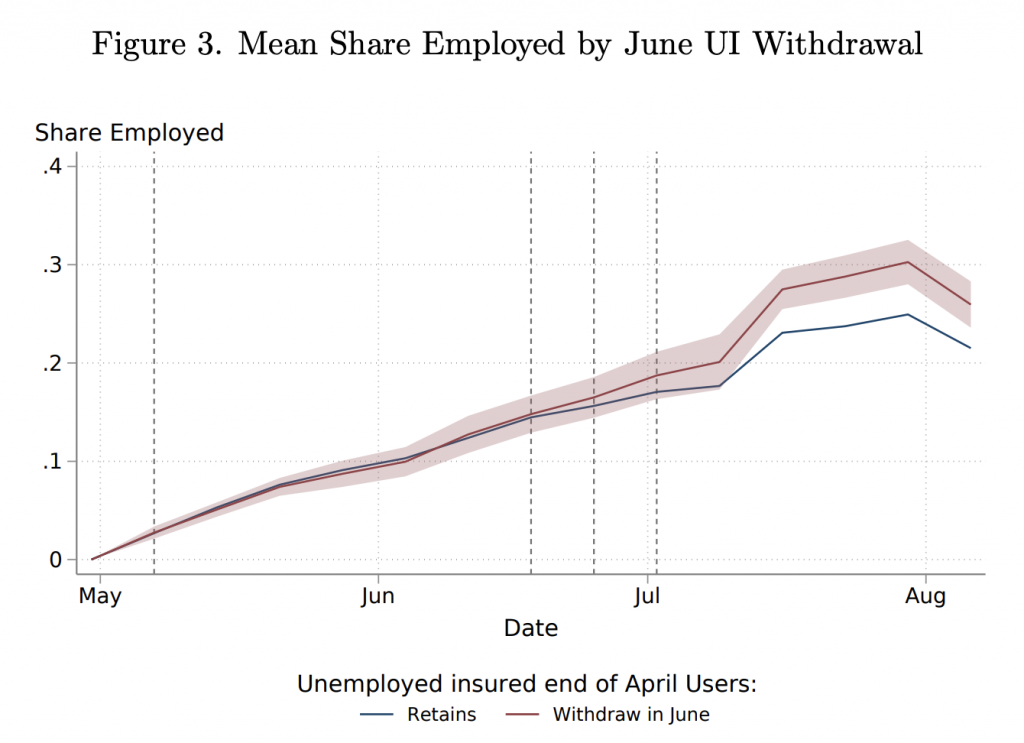
The first step towards answering this question is to shift away from the aggregate picture and focus our analysis only on people who were receiving unemployment benefits prior to the cuts. When you focus exclusively on those people, you do see some additional success at finding jobs. Not much, but some.
Thus, in Coombs et al, we learn that 21.5 percent of people who were on UI in states that did not cut benefits found a job between the end of April and early August. In states where UI was cut, the same number was 4.4 percentage points higher at 25.9 percent.
And in a recent Arin Dube analysis of the Current Population Survey, we see that around 25 percent of people moved from unemployed to employed in the last month in states that hadn't cut benefits. In states that had cut benefits, the same number was around 31 percent. The difference is within the margin of error, but it is consistent with the findings in Coombs et al.
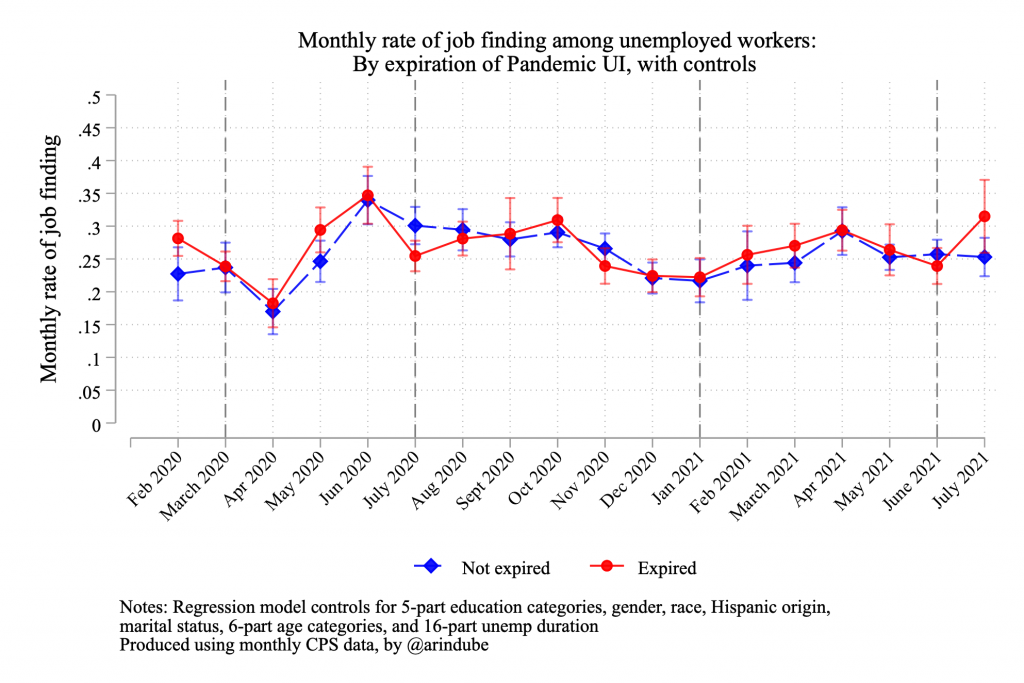
These findings raise an obvious question: if people who experienced unemployment benefit cuts are finding jobs at a slightly higher rate than those who didn't, then why don't we see this reflected in the aggregate job numbers? The logical answer to this is that this extra job finding is coming at the expense of other jobseekers who are not on UI and who would have otherwise been hired for the the same job.
This is called job rationing and Dube finds support for this conclusion in his analysis of the CPS. Specifically, if you look at the percentage of people who moved from not-in-labor-force (NILF) to employed across the two groups of states, it is a mirror image of the graph above.
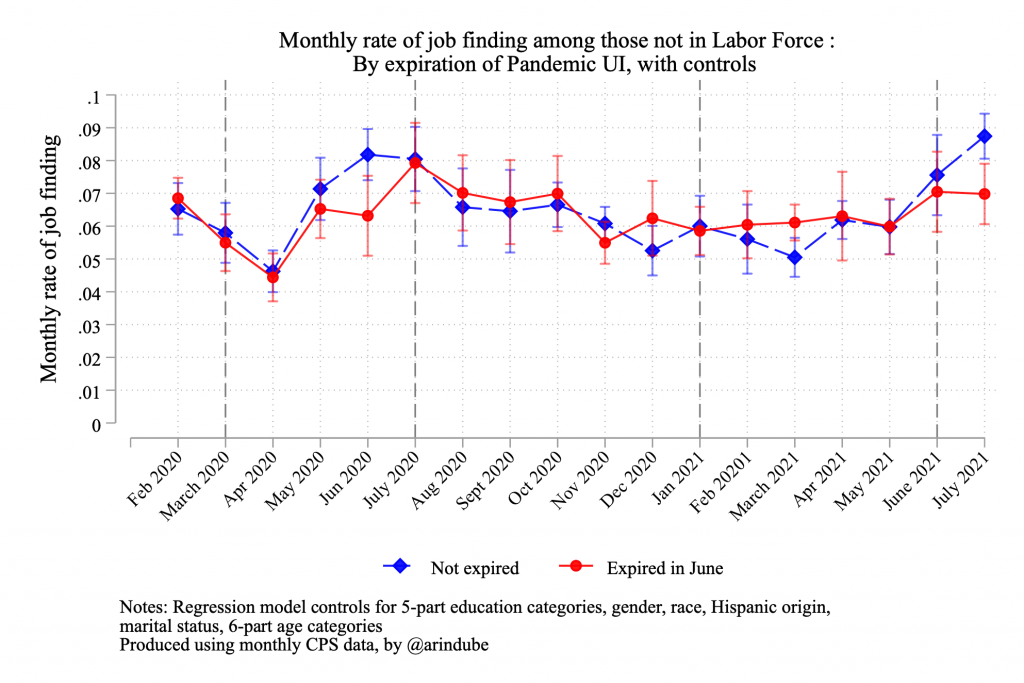
Dube elaborates: "the resulting reduction in job finding from NILF seems to more than erase the jobs gains from increased job finding among unemployed."
In total, then, these unemployment benefit cuts are only slightly increasing job finding among those who used to receive the benefits, and that job finding is coming entirely at the expense of other jobseekers. We did not increase employment. We just slightly changed the composition of it while dramatically reducing incomes and spending among the unemployed population.
There is still time to avoid the major UI cuts that are coming on September 6 in the 24 states that have not yet cut benefits. If we take seriously the idea that state-level experimentation and data collection should help guide political decision-making, then there is no doubt that those cuts should be put off by Congress and that benefits should be reinstated in the 26 states that have already cut them. Instead, reactionary anti-welfare ideology is likely to ensure these Labor Day benefit cuts happen even though they do not accomplish what their proponents claim they are for.