

Over at the New York Times, Patrick Brown has an opinion piece that argues that making the new Child Tax Credit (CTC) permanent has very little support among the public and is deaf to the real concerns of the working class. The piece is pegged to yesterday's release of a YouGov poll commissioned by the conservative organization American Compass. But when you actually dig through the results of the poll, it reaches the opposite conclusion.
Every Element of the New CTC Has Majority Support
Figure 5 of the report asks 2,000 registered voters (not a sample of all adults, it's worth pointing out) whether they support making the three elements of the new CTC permanent. All three elements received majority support, including providing the CTC to families where no one in the household is working.
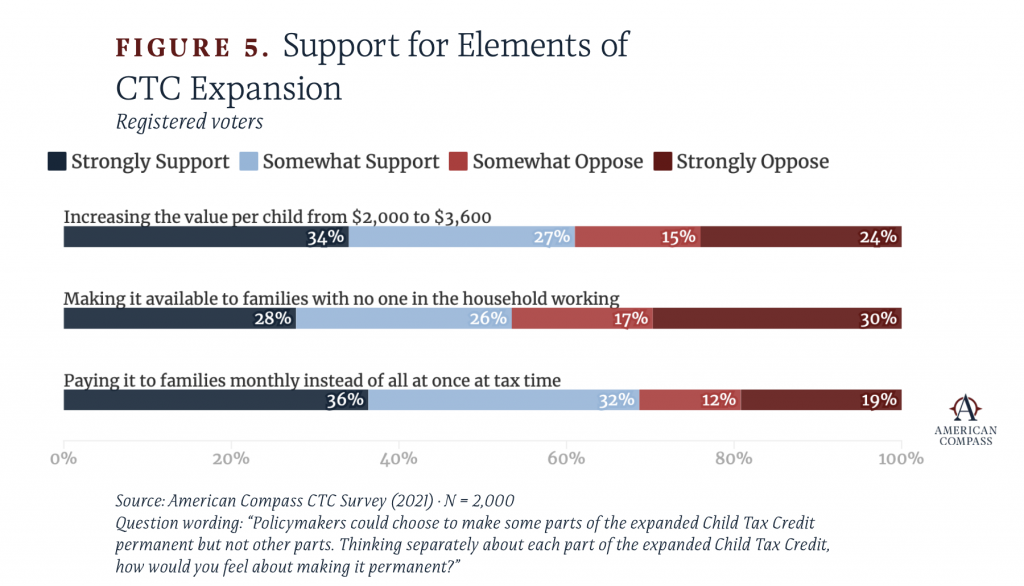
The finding that 53 percent of registered voters explicitly support making the CTC permanently available to households with no workers is truly remarkable. Until recently, the conventional wisdom was that this sort of thing is extremely unpopular. And yet here it is with a slim majority in favor.
Brown makes no mention of this in his piece and instead decides to represent the findings of the poll this way:
Polling, however, finds the child benefits have lagged in popularity. A new YouGov/American Compass poll found that only 28 percent of voters said they preferred the expanded Child Tax Credit to be made permanent and go to “all families, regardless of whether they work to earn money.”
This is also how American Compass tried to represent the poll, but the way they get to this number is laughable.
They start by asking the respondents to choose between four very general positions on the CTC and get the following result.
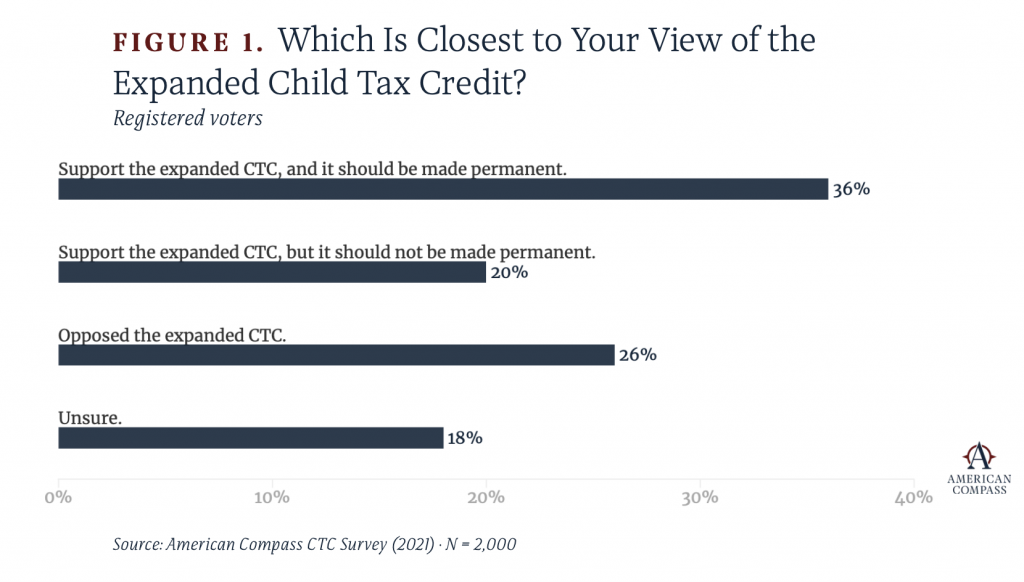
If you wanted to get useful information on where people stood on making the new CTC permanent, you would just ask them directly whether they support or oppose making the new CTC permanent, similar to what they do in Figure 5 above. But that's not what they do. Instead, they present this less direct question that gives people one way of saying they support making it permanent and three ways of saying they don't and thereby drive down the percentage of people who select support.
But they don't stop there. According to the report, the 36 percent of people who answered that they support making the new CTC permanent were then hit with another question that gave them the option of saying they prefer making the CTC permanent "but only for families that have at least one adult working." Twenty-three percent of the initial 36 percent clicked that button on the web poll and were thus removed, leaving us with the conclusion that only 28 percent of people support making the new CTC permanent.
Polling is kind of garbage as a general matter, but within that garbage, some things smell worse than others. The questions in Figure 5 that directly ask people to register their support or opposition to making parts of the new CTC permanent generate far better information than the ridiculous process they used to generate the 28 percent number. To not even mention these majority-support findings when writing about the poll is highly misleading.
The Working Class Opinion
After dropping this misleading poll number, Brown turns to theorizing why the elites can't comprehend how the number could be that low (it isn't really that low). And the answer is that they don't understand the working class. To get a sense of what the real working class thinks, we are asked to consider the results of focus groups conducted by the conservative Institute for Family Studies (IFS). In these focus groups, we learn that the working class participants had all sorts of views about all sorts of things but that the overall tilt of their opinions line up remarkably well with the institutional bent of IFS.
If summaries of focus group conversations don't move you, the American Compass report presents the results from Figure 5 broken down by "class."
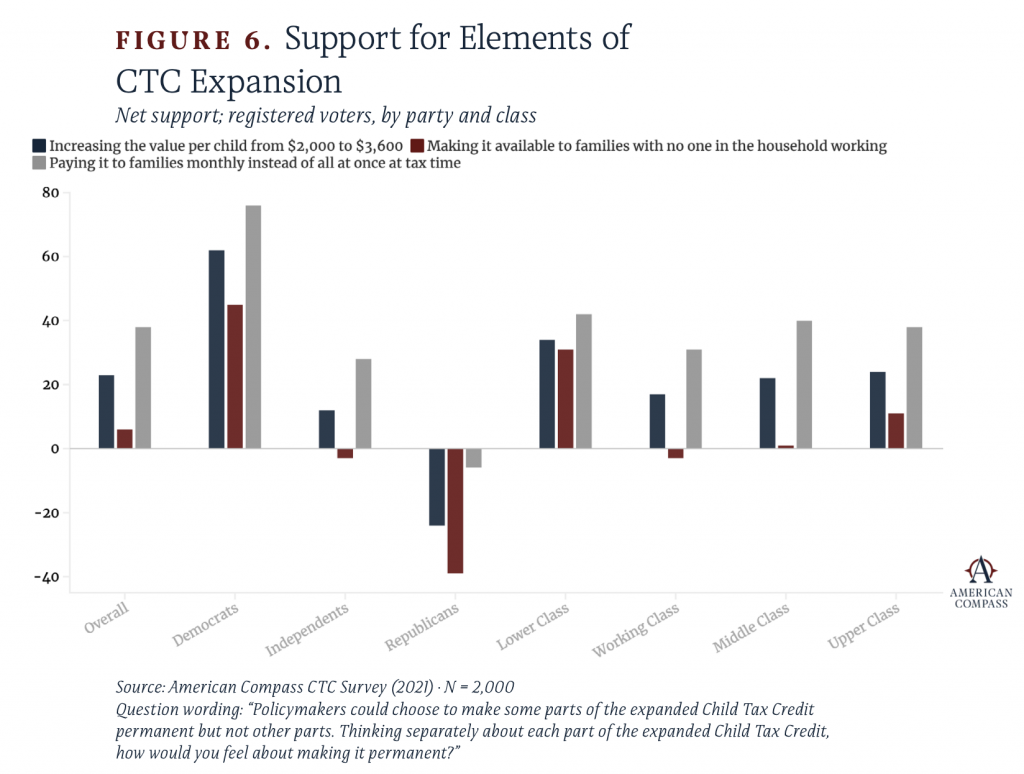
What this reveals is that every single element of the new CTC has the majority support of every single class with one exception, which is that only ~48% of "working class" people support extending the credit to households with no workers. This one element being slightly underwater among this one group is apparently a symptom of the great cultural divide that needs some grand theory to explain, even though the working class number is only a few points shy of the apparently very different "middle class."
Normally I try not to get sucked into debates about how to define the "working class," but in a case like this where the phrase is being used as a deceptive rhetorical bludgeon, it is worth spending a little time teasing out how American Compass decides who belongs in what class.
In analysis of the results, “Class” is defined by education and income:
“Lower” (N=358): less than a four-year degree and household income below $30K; or did not report household income and do not have a high-school diploma.
“Working” (N=608): less than a four-year degree and household income $30K–$80K; or did not report household income and have either a high-school diploma or some college but no degree.
“Middle” (N=770): four-year degree or more and household income $30K–$80K; or household income $80K-$150K; or did not report household income and have a 2-year or 4-year college degree.
“Upper” (N=181): household income above $150K; or did not report household income and have a post-graduate degree.
Respondents with a four-year college degree or more but household income below $30K are excluded from analyses using the “Class” variable.
I've seen plenty of class taxonomies in my day, including many that use education and income to create class groups, but I've never seen anything quite like this.
It's pretty common to describe the working class as consisting of people without college degrees. It is also pretty common to describe the working class as consisting of people with incomes below a certain level. But I've never seen someone say that a family headed by a high school graduate working at a job that pays $25,000 per year is not working class. If anything, this is the epitome of the working class in the way the phrase is normally used.
It is only by hiving off the bottom third of the working class (as the phrase is typically used) and dumping them into a separate "lower class" that American Compass is able to say that a slim majority of working class people oppose providing the new CTC to households where nobody is working.
Aside from this narrow point, I can't help but point out that American Compass is just completely lost when it comes to creating a definition of class that is an index of education and income. Clearly the general gist they are reaching for is that class position increases as income and education increases. But when they are confronted with the reality that education and income aren't always paired together, they have no idea what to do about that and even go as far as simply eliminating from the sample anyone that has both a high education and a low income.
A much better approach here would be to assign each individual a certain number of points for their education and a certain number of points for their income and then sort the survey respondents into quartiles or quintiles based on their total number of points.
For education, the points would look like this:
- Less than High School - 1
- High School - 2
- Four-Year Degree - 3
- Post-graduate degree - 4
For income, the points would look like this:
- $0k - $30k - 1
- $30k - $80k - 2
- $80k - $150k - 3
- $150k+ - 4
For households that do not report their income, you can just use their educational points for their income points as well.
Under this points system, every individual will end up with anywhere from 2 to 8 points. Since the sample has 2,000 respondents in it, the bottom 500 scorers would be the lowest class quartile, the top 500 scorers would be the top class quartile, and the middle 1,000 scorers would be class quartiles two and three. This is basic stuff and it's honestly astonishing to me that American Compass doesn't know how to do it or even more bizarrely opts not to.