

Late last month, I wrote a piece explaining why some people might say the economy under Biden has not been so good. For left-wing intellectuals, Biden's failure to reform the labor market (e.g. through the passage of the PRO Act) and failure to reform the welfare state (e.g. through the passage of Build Back Better) provide plenty of reason for disappointment. For regular people, the unwinding of the COVID welfare state and inflation caused real incomes to decline for most.

The latter point about changes in real income generated a lot of responses.
The most common response was that people shouldn't be mad because they should realize that the COVID welfare state was always going to be temporary and that inflation was either out of Biden's control or a risk worth taking as part of ensuring that there was sufficient aggregate demand. This response may have some merit, but "people should be more understanding about why their economic circumstances are worsening" is different from "people's economic circumstances haven't worsened," which is the argument that so many have been making up to this point.
Another response I got was that I should broaden the analysis beyond inflation-adjusted incomes and specifically that I should look at wealth. This is a fair point. Income as measured in the Current Population Survey is not the only quantity relevant to financial well-being. For example, the fact that 10 million people have been kicked off of Medicaid as part of the unwinding of the COVID welfare state is not well-captured in the graph above, but surely is not great for those experiencing it.
Those talking about wealth tend to point to the 2022 Survey of Consumer Finances, which was released in the last couple of months, and received a lot of coverage, especially of the "everything is great" variety. The problem with this coverage is that the SCF is conducted once every three years. This means that, at best, the data only allows you to compare 2022 to 2019.
Between 2019 and 2022, wealth has increased (more on that below), but it's possible that this is because wealth increased a lot in 2020 and 2021 while coming down in 2022 and more recently. This is, after all, what happened with income. If that is also what has happened with wealth, then it is understandable why people may be a bit bummed out about their very recent experience with the economy.
One indicator that something like that has happened with wealth that is especially relevant to day-to-day finances comes from bank account data published by JP Morgan.
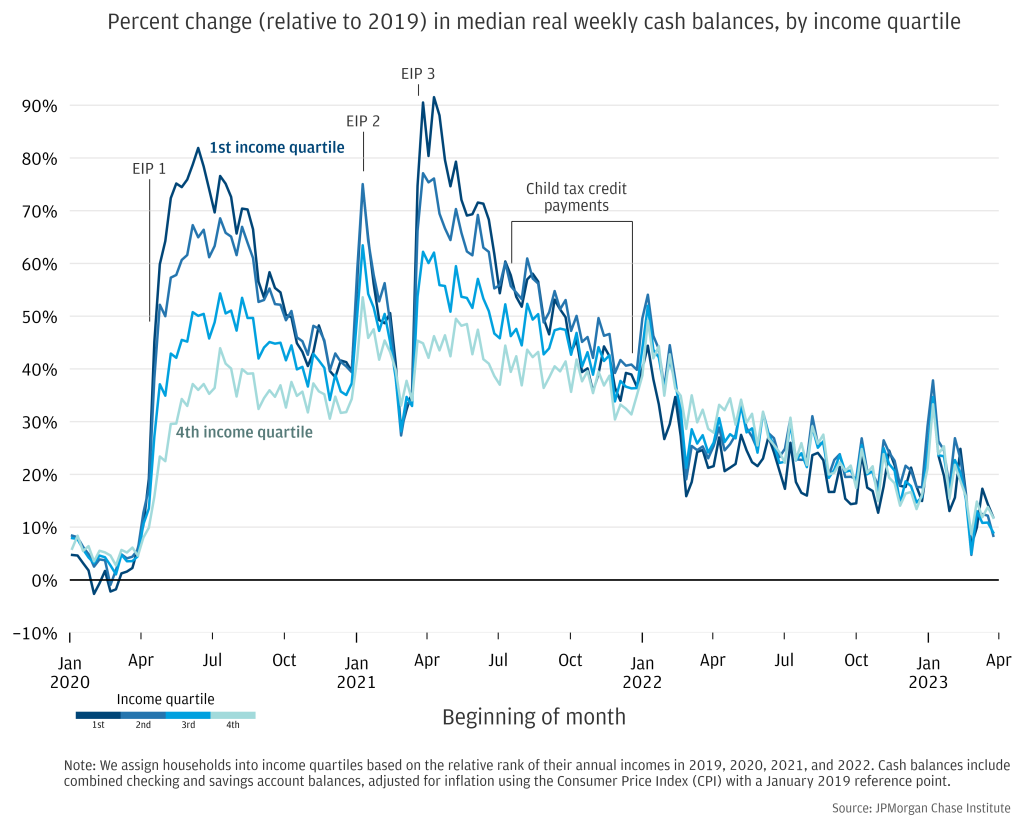
In this data, we see balances in checking and savings accounts increase in lockstep with the COVID welfare state (EIP refers to the stimulus checks). They reached their highest levels in early 2021 and have steadily declined ever since. Fair or not, watching your cash balance decline by 40 percent at the same time that incomes are being rocked by welfare cuts and inflation could make you dissatisfied with your personal finances.
When it comes to the SCF data, things are not as clear as they might seem on first glance. Between 2019 and 2022, the average wealth of the median quintile increased by $54,406.

In the SCF, there are 42 different categories of assets and liabilities that go into a family's net worth. Over this period, the assets of the median quintile increased by $72,075 (132% of the net worth increase) while the debts increased by $17,699 (-32% of the net worth increase).
There are a number of ways that you can slice and dice these different categories, but regardless of how you do it, the story is the same: the wealth increase is overwhelmingly driven by used home and used car inflation. Over this period, the average value of primary residences increased by $47,459 for the median quintile. The average value of vehicles increased by $6,358. Together, primary residences and vehicle value growth was equal to 99 percent of the median quintile's increase in net worth.

Of course, primary residences and vehicles often come with secured debts. When we take those into account, we find that primary residence equity and vehicle equity account for $40,194 (or 74 percent) of the growth in median quintile net worth.
This finding conforms with price indexes showing that the prices for used homes and used cars spiked by over 40 percent between 2019 and 2022.

The jump in prices for used cars and used houses are real changes in net worth, but are also of limited utility to regular people who need their home and car in order to live their lives. People who have second homes and second cars could sell those assets in order to take advantage of the capital gains from the inflation. But that's not something non-rich people generally have.
The run up in home and car prices is obviously bad for those looking to buy their first home or replace their worn-out car.
Current homeowners who are looking to switch homes will, on average, find that home price inflation is a wash but that increased interest rates mean that, even if they switch to an identical home, they will be facing much higher monthly mortgage payments.
Home price increases can sometimes be accessed in place through things like home equity loans or home equity lines of credit. But with interest rates for these financial products now in excess of 9 percent, tapping home values for consumption in this way is not as viable as it once was.
So, the wealth statistics don't really point towards a huge improvement in the financial circumstances of regular people. This is especially true when we look at indicators from the last couple of years, which show things like cash balances rapidly declining.