

In continuing with our coverage of the recently-released 2016 Survey of Consumer Finances, I thought it would be interesting to see how wealth is distributed within each racial group.
Overall what you find is that wealth distributions are basically the same within each racial group, though wealth magnitudes obviously differ considerably between racial groups.
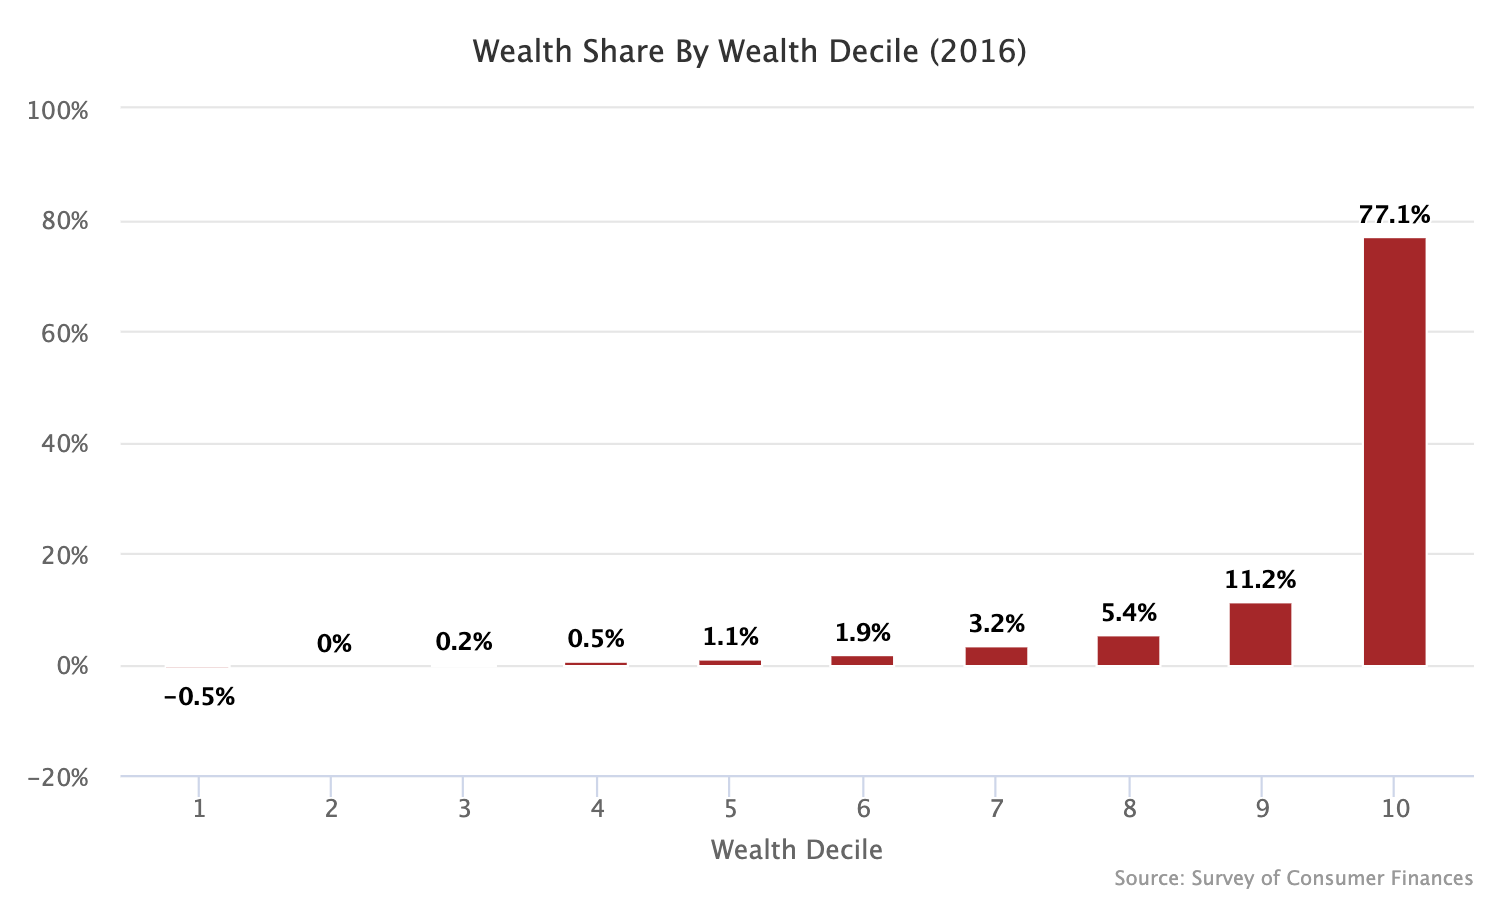
Overall Wealth Distribution
Here is how wealth is distributed overall. What this says is that the bottom 10 percent owns -0.5 percent of the wealth (they are net debtors), the next 10 percent owns 0 percent of the wealth, and so on until you get to the 10th decile, which says the top 10 percent owns 77.1 percent of the wealth.
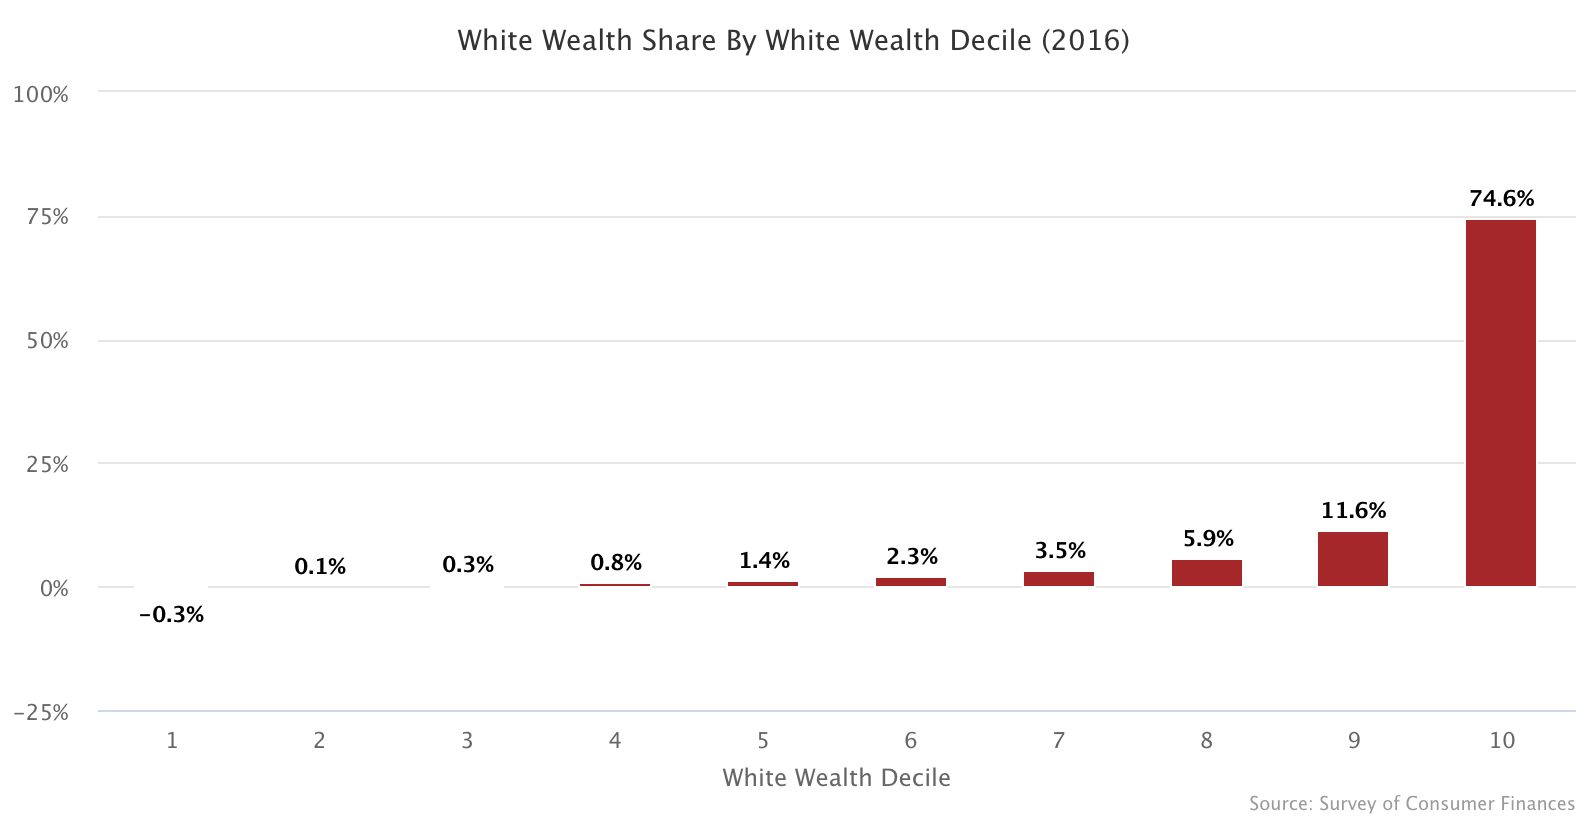
White Wealth Distribution
Here is the same graph for white families.
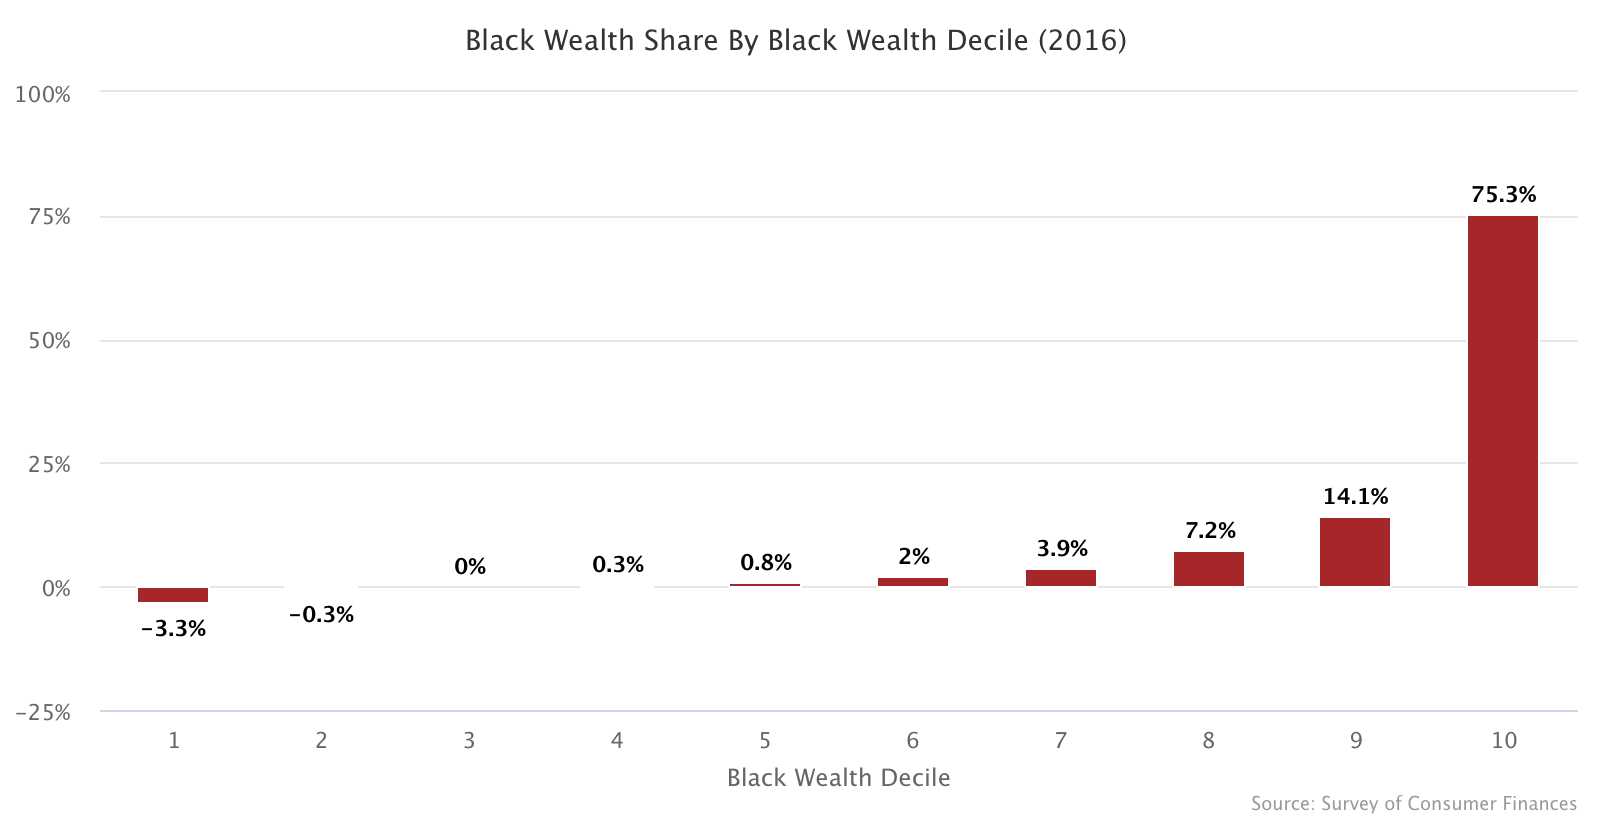
Black Wealth Distribution
Here is the graph for black families.
Latino Wealth Distribution
Here is the graph for Latino families.
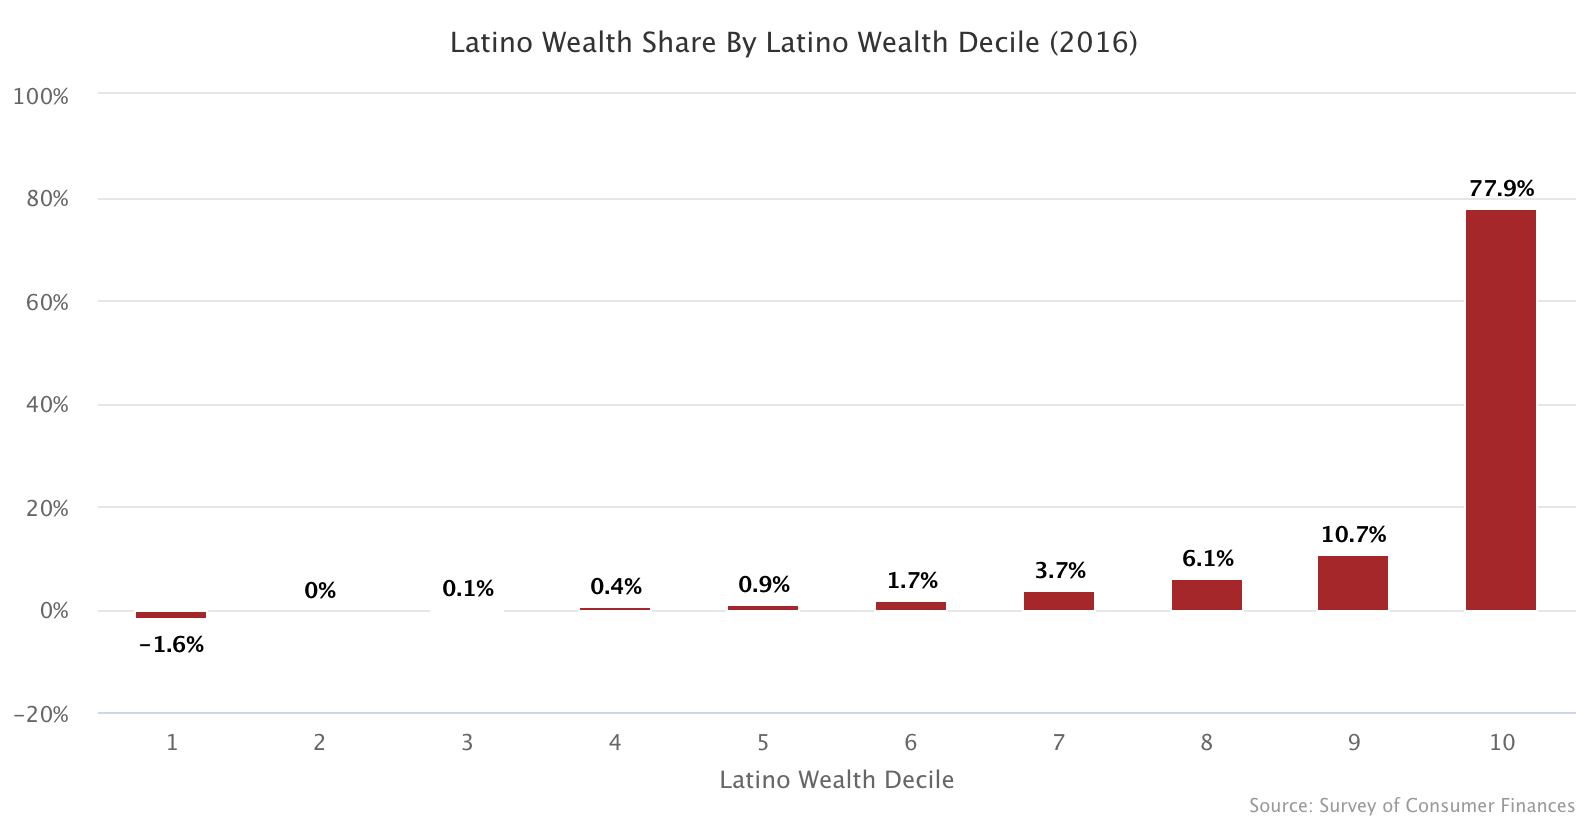
In all cases, the top 10 percent owns about three-fourths of that racial group's wealth, while the bottom half owns virtually none of it.
The One Percent
Most of the gains over the past few decades have accrued to the top one percent. Here is what percent of each racial group's wealth is owned by the top one percent.
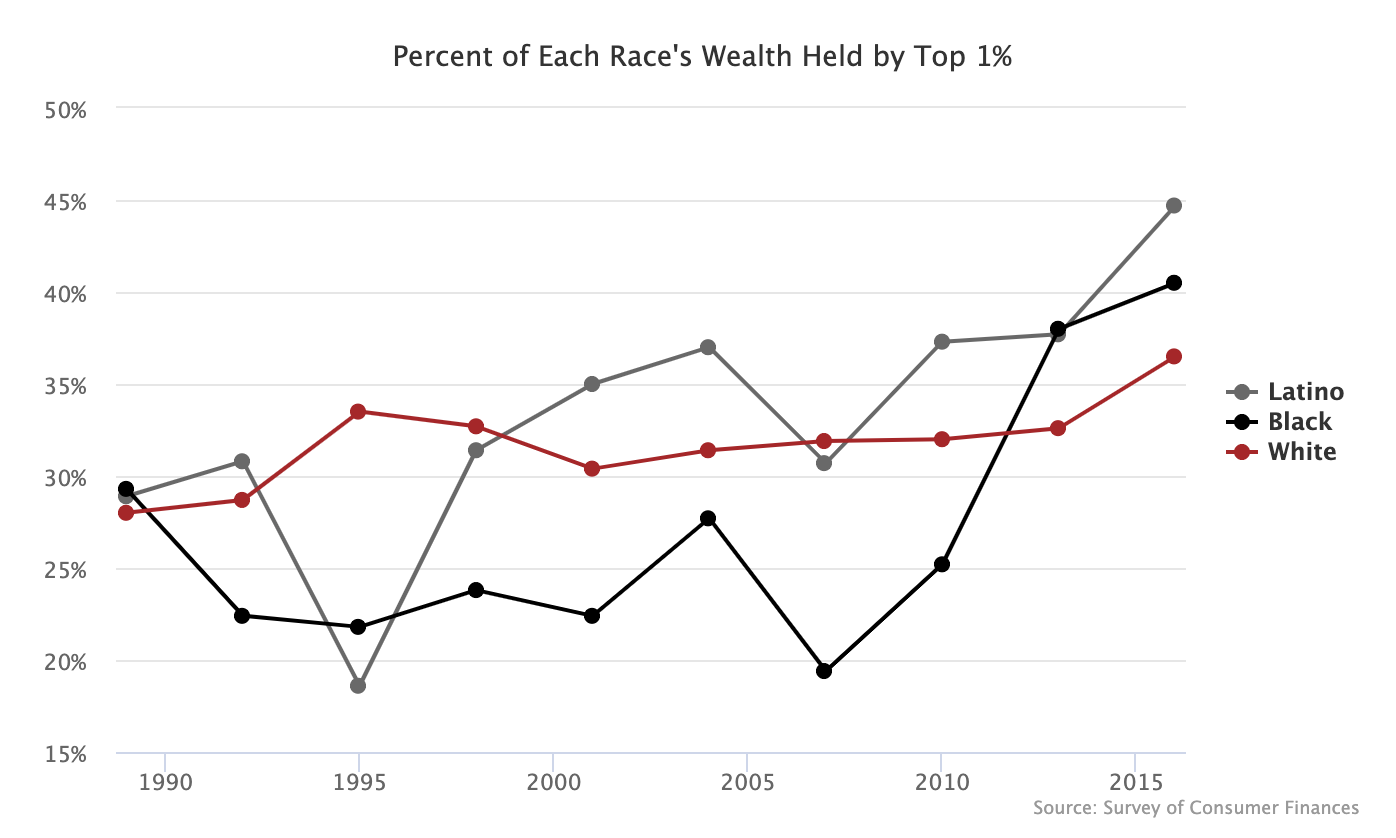
In 1989, the top one percent in each group owned around 28-29 percent of that group's wealth. By 2016, the white one percent owned 36.5 percent of white wealth; the black one percent owned 40.5 percent of black wealth; and the Latino one percent owned 44.7 percent of Latino wealth.