

Last month, the Council of Economic Advisors put out a report about the evils of socialism. In it, the report authors provide a comparison of how much it costs to operate a pickup truck in the US and the other Nordic countries.
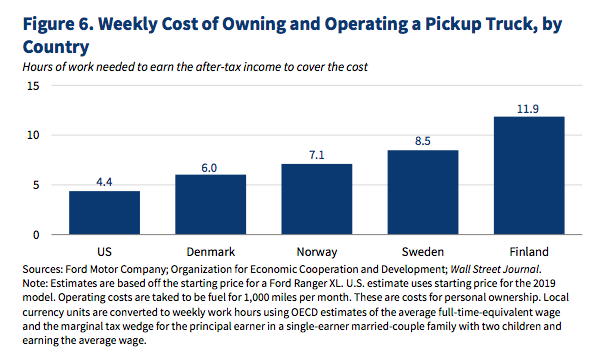
A lot of laughs were had over the graphic, but nobody pointed out the deception at the heart of the graphic. It's important to understand how this deception works because it shows up over and over again in hackish writing about the Nordic countries.
General Trick
The best way to understand the general trick underlying this deception is to use an example.
Imagine a man named Tom who is paid $100 per hour. Tom is subjected to a 20 percent income tax, meaning his take-home pay is $80. When Tom goes to spend that $80, the goods he purchases are subject to a 33 percent sales tax (or VAT), meaning he only actually gets to buy $60 worth of goods. So for every hour Tom works, he earns $100, but only really gets to spend $60 on consumption.
Now imagine a woman named Sally who lives in another country where she, like Tom, makes $100 per hour. But this country has a 10 percent income tax, making her take-home pay $90. And it has a 12.5 percent sales tax (or VAT), meaning that her $90 of take-home pay enables her to buy $80 worth of goods.
If the pre-tax price of a shirt is $10 in both countries, then Sally can buy 8 shirts ($80) for every hour she works while Tom can only buy 6 shirts ($60) for every hour he works. That's 33 percent more shirts for the same amount of labor! Or so the peddlers of this analysis, including now the CEA, would have you believe.
The problem with this analysis is that it counts the taxes paid against the affordability of the shirts, but it does not count the benefits received towards the affordability of the shirts. Tom pays twice as much tax as Sally, but that money does not get thrown away. Instead, it gets put towards benefits like health care, child care, and higher education subsidies. Once you factor in the fact that Sally has to pay for these things out of her own pocket while Tom does not, you see quite clearly that Tom can actually afford just as many shirts as Sally can.
Given the fungibility of money, paying taxes for services that you would otherwise have to buy out of pocket does not actually make it harder for you to afford the things (like shirts and trucks) that taxes do not pay for. It is thus completely nonsensical to do a calculation that treats taxes paid as a total loss that prevents you from buying more things.
Specific CEA Failures
The CEA analysis is also specifically flawed in ways that go beyond the general trick described above. When determining what income tax rate to apply for the analysis, the CEA uses "the marginal tax wedge for the principal earner in a single-earner married-couple family with two children and earning the average wage." The "marginal tax wedge" is indisputably the wrong figure to use for these purposes for two reasons.
First, the marginal tax wedge includes the taxes paid by employers, e.g. employer-side social security contributions. This is a useful number for a lot of purposes, but not this one. If the average wage is $100, the personal taxes paid are $15, and the employer taxes paid are $5, then the marginal tax wedge is $20 / $105 = 17 percent. But the relevant rate is the personal tax rate: $15 / $100 = 15 percent. That is the rate that actually tells you how much take-home pay results from a given wage.
Second, the marginal tax rate (whether calculated as personal taxes or total tax wedges) refers to how much tax such a worker would pay on an additional hour of labor beyond the amount of hours they already put in. But the CEA estimate is based on a single-earner family where the principle earner is already working full time. So the question CEA is actually addressing in the graphic is how many overtime hours you would have to work in order to buy a truck using only your income from those overtime hours.
This is utterly bizarre. Presumably what people care about is not how many overtime hours it takes to afford a truck, but rather how many of their non-overtime hours it takes them to afford a truck. For that figure, you would not use a full-time worker's marginal tax rate on the 41st hour (assuming 40 hour workweek) but rather their average tax rate on their 40 regular work hours.
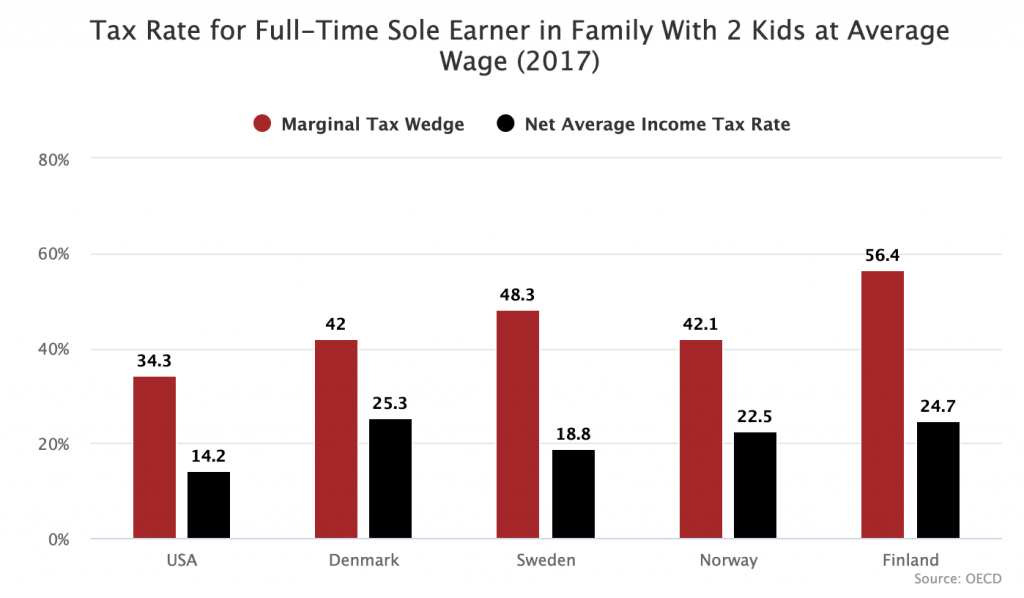
The net average income tax rate is much lower for all the countries. When using average income tax rates rather than marginal tax wedges, the gap between the US and the other countries shrinks considerably for every country except Denmark.
It deserves emphasizing once again here that counting these higher taxes against the affordability of a truck without considering the financial relief provided by the benefits funded by these taxes is completely nonsensical hack analysis. But what's amusing here is that the CEA took this deceptive approach to an even greater level by using the wrong tax rates.