

Every quarter, the Federal Reserve puts out the Financial Accounts (aka “Z1” or “Flow of Funds”), which provide economy-wide aggregates for nearly every kind of asset and liability there is. Every three years, they put out the Survey of Consumer Finances (SCF), which is a household survey that records many of the same kinds of assets and liabilities that are in the Financial Accounts. In a perfect world, the assets and liabilities in the SCF would sum up to the aggregates in the Financial Accounts, but for various reasons they do not.
Recently, the Federal Reserve released a new data series called the Distributive Financial Accounts, which combine the Financial Accounts and the SCF to provide quarterly estimates of the distribution of wealth in America that do sum to the aggregates in the Financial Accounts. The series goes back to 1989, the first year the modern SCF was administered and runs to the fourth quarter of 2018, the last quarter for which there is Financial Accounts data.
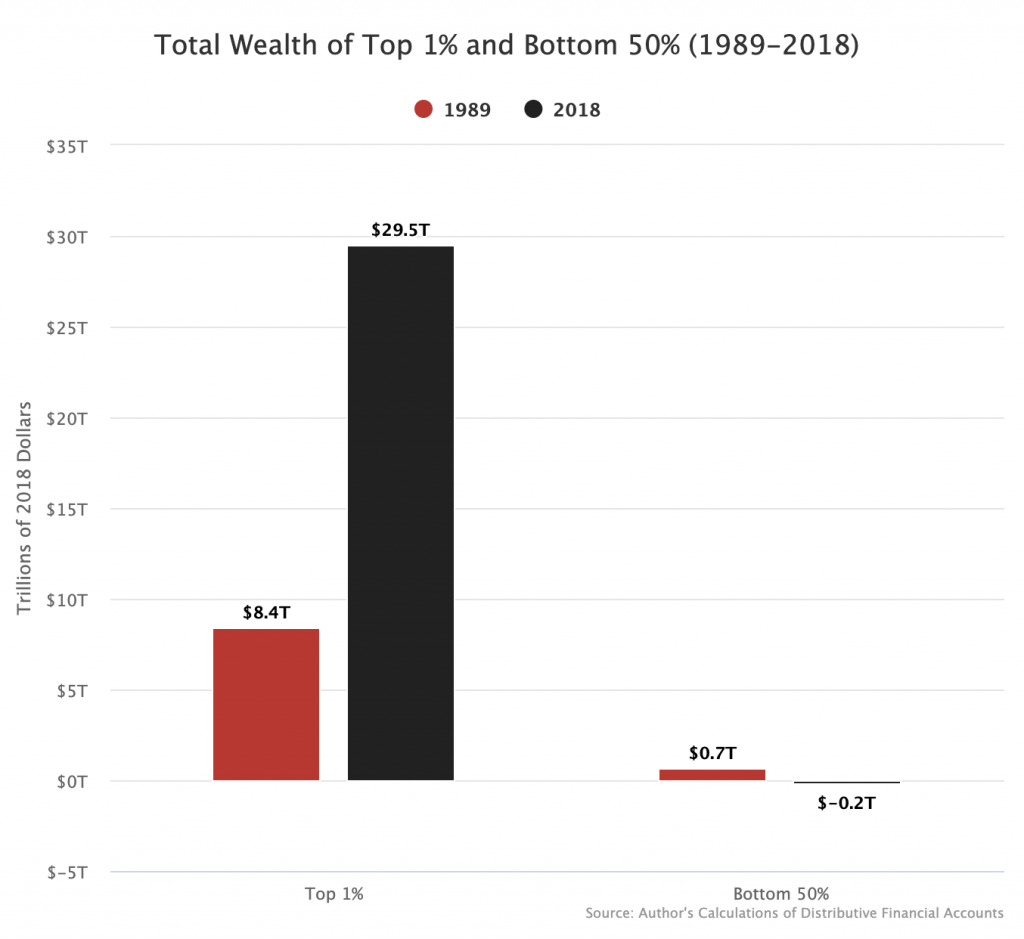
The insights of this new data series are many, but for this post here I want to highlight a single eye-popping statistic. Between 1989 and 2018, the top 1 percent increased its total net worth by $21 trillion. The bottom 50 percent actually saw its net worth decrease by $900 billion over the same period.
To derive this, I initially take the nominal net worth aggregates for each wealth group that are provided by the Federal Reserve and subtract out consumer durables. Consumer durables are things like cars and fridges that many academics who work on wealth distributions do not consider wealth. The average person in the top 1 percent owns around 32x as many consumer durables (in dollar terms) as the average person in the bottom 50 percent owns. So the subtraction of them reduces the inequality between the top 1 percent and bottom 50 percent.
From there, I adjust the 1989 figures to 2018 dollars using the CPI-U-RS price index. This is what the Federal Reserve also does to adjust wealth figures over time in its Survey of Consumer Finances reports.
What the final product reveals is a 2018 where the top 1 percent owns nearly $30 trillion of assets while the bottom half owns less than nothing, meaning they have more debts than they have assets. This follows from 30 years in which the top 1 percent massively grew their net worth while the bottom half saw a slight decline in its net worth.