Some people think poverty is what results when employers exploit workers on the bottom of the labor market. Other people think poverty is what results when individuals behave in dysfunctional ways. These two dominant theories then generate a variety of policy ideas, including increasing educational attainment and work incentives to improve labor market outcomes, changing employment rules so as to increase pay for lower-level workers, and instructing people to change the way they engage in family formation, among other things.
When I first got interested in practical poverty policy nearly two decades ago, I went into it with these two theories in mind, assuming that what I was likely to find was that employer exploitation was the better theory of the two. What I found instead was that both theories are way off the mark and that poverty in developed countries is actually much simpler and much dumber than all of that. It’s not bad behavior by employers or degenerates. It’s just what happens when the following conditions are present:
- The national income is distributed using payments to laborers and capital owners.
- Capital ownership is very unevenly distributed across families.
- A large share of the population is not working at any given time.
- Nonworkers are unevenly distributed across families.
People really seem to want poverty to be something much bigger than all of that. Its existence in a rich society is so troubling that it seems to call out for a heavier explanation. But it really is just a simple math problem that has a very straightforward solution.
The Problem of Nonworkers in Capitalism
The way a simplified version of a capitalist economy works is that land, capital, and labor are supplied as inputs to production, the owners of those inputs receive payments, and then those payments can be used to buy the outputs of production. Because these payments — variously called factor payments, factor income, or market income — only go out to laborers and capital owners, anyone who is neither of those things will not receive direct, personal income in this system.
In our society, the ownership of capital is very highly concentrated, meaning that very few people own significant amounts of capital and therefore very few people receive significant capital income.
You could imagine creating a society where capital ownership is not so highly concentrated. This could be achieved fairly simply by creating a social wealth fund where much of the nation’s capital stock is held collectively and each person is entitled to an equal share of the investment return. Alaska has a modest fund like this that significantly reduces alternatively-measured wealth inequality in the state while paying out thousands of dollars each year to every resident. These universal dividend payments reduce the number of impoverished Alaskans by 20 to 40 percent every year.

Norway has a huge fund like this that radically reduces alternatively-measured wealth inequality in the country, but it uses the return as a source of general government revenue, not to fund individual dividends.
Whatever the merits of these alternative approaches to managing capital ownership, they are not relevant to our analysis of poverty in America because the country does not use them. Overall, capital ownership in the US is very skewed towards the top of the society and therefore has little impact on keeping poverty low.
With capital income out of the equation, all that is left is labor income: wages, salaries, self-employment income, and similar. Labor income is more evenly distributed than capital income, but its ability to keep poverty low is hampered by the fact that, at any given time, around half of the population is not working and therefore does not receive any personal labor income.
As with capital ownership, I suppose you could imagine a society where nonworkers were somehow evenly distributed across families such that every family had an equal number of workers and nonworkers. Unlike with capital ownership, it is not very easy to come up with a mechanism that could achieve such a thing and it seems undesirable in other respects, but it is at least possible in the abstract. Because poverty is measured on the family level, a society so composed would be one where each nonworker would be effectively assigned income from a cohabitating worker, thereby keeping poverty low.
But in reality, nonworkers are very unevenly distributed across households. Forty percent of people live in families where more than half of the members work. Another 40 percent live in families where less than half of the members work. Sixteen percent of people live in families where none of the members work. Only 20 percent of people live in families that have the 1-to-1 ratio of workers to nonworkers. The graph below shows what this all looks like across the entire distribution.
This point about the unequal distribution of nonworkers across families can be illustrated in a number of other ways as well. The below graph simply counts the raw number of nonworkers in each person’s family and shows that across the distribution. At the most extreme end, there is a family with 12 nonworkers in it. Around 22 percent of individuals live in families with three or more nonworkers in them while 25 percent live in families with no nonworkers in them.
We can even produce this same graph using “net workers,” which I define as the number of workers minus the number of nonworkers in each family. At the extremes, there is a family with 12 more nonworkers than workers and a family with 8 more workers than nonworkers. Predictably, at the median, it is a wash: there are as many workers as nonworkers, generating an outcome of zero net workers.
One last way of illustrating this is by adding up the number of hours worked by each family and dividing it by the number of family members. As can be seen in the graph below, about 16 percent of people live in families with no hours worked. The first plateau between the 50th and 60th percentiles are families with 1,040 hours worked per family member, which is equivalent to one full-time worker for every nonworker. The second plateau between the 80th and 90th percentiles are families with 2,080 hours worked per family member, which are families exclusively composed of full-time workers with no nonworkers.
The problem created by this unequal distribution of nonworkers across families is that, at the bottom, you wind up with too few workers attempting to support too many nonworkers. The labor income that makes it into these families simply gets stretched too thin. We can see this in the next two graphs, which show the market poverty rates of families with different mixes of workers and nonworkers and different amounts of hours worked per family member. The phrase “market poverty” refers to individuals who are in poverty if we exclude government benefits. In these graphs, each bar represents about 20 percent of the US population.
The bottom 20 percent of individuals so defined make up a little over two-thirds of the market poor. The bottom 40 percent make up over 90 percent of the market poor. Notably I was able to deduce all of this without ever peaking to see what any given individual’s wage rate was. That’s because it is the uneven distribution of nonwork across families that is driving all of this.
Who Are the Nonworkers?
The presentation above lends itself to the natural conclusion that we could whip poverty by simply converting a bunch of these nonworkers into workers. But when we look at who the nonworkers actually are, we quickly see that this is not really possible or desirable.
As noted above, around 48 percent of the population does not work in a given year. In the graph below, I sort all of these nonworkers into one of eight categories. Individuals who fall into more than one category are assigned to the first category they qualify for in order from the top of the graph to the bottom of the graph.
Together, children and elderly people make up nearly three-fourths of all nonworkers. Adding the disabled and students gets you to 86 percent of all nonworkers. There are things you could do to activate some of these nonworkers into the labor market, such as providing child care benefits to reduce the number of at-home caregivers, if that is the kind of thing that excites you. But, for the most part, unless you want to relax child labor laws or take away retirement security, this is just what society looks like.
Not surprisingly, market poverty plagues the nonworkers. In the below graph, we see the market poverty rate for these eight categories. At the bottom I’ve added a bar for individuals who worked 50 or more weeks during the year for comparison.
The Obvious Solution
When I started this piece, I claimed that poverty occurs when the following four conditions are present:
- The national income is distributed using payments to laborers and capital owners.
- Capital ownership is very unevenly distributed across families.
- A large share of the population is not working at any given time.
- Nonworkers are unevenly distributed across families.
One could do more, but I think I have demonstrated this all pretty well using the most recent Census income microdata. If this is a correct diagnosis of the problem, then the solution involves flipping one or more of these four conditions.
Some social conservatives implicitly argue for flipping the last condition by somehow (they never quite explain the mechanism) increasing parental cohabitation or perhaps even increasing the number of multi-generational households. If that’s a lifestyle you like and you want to convince others to adopt it, that’s fine. But it doesn’t seem likely to move the needle much and I do think it is wrong for a society to economically coerce individuals to live together by threatening poverty if they don’t.
As noted already, there are some things you could do to reduce the number of nonworkers a bit, but absent pretty repugnant reversals in our views about child labor and retirement security, the third condition is not likely to change significantly.
Flipping the second condition by redistributing capital ownership is actually a reasonably fruitful path to poverty reduction. In Alaska, it reduces poverty by 20 to 40 percent, and they could certainly go further with it than they have. I like this idea for lots of reasons, though I don’t think it would be adequate by itself.
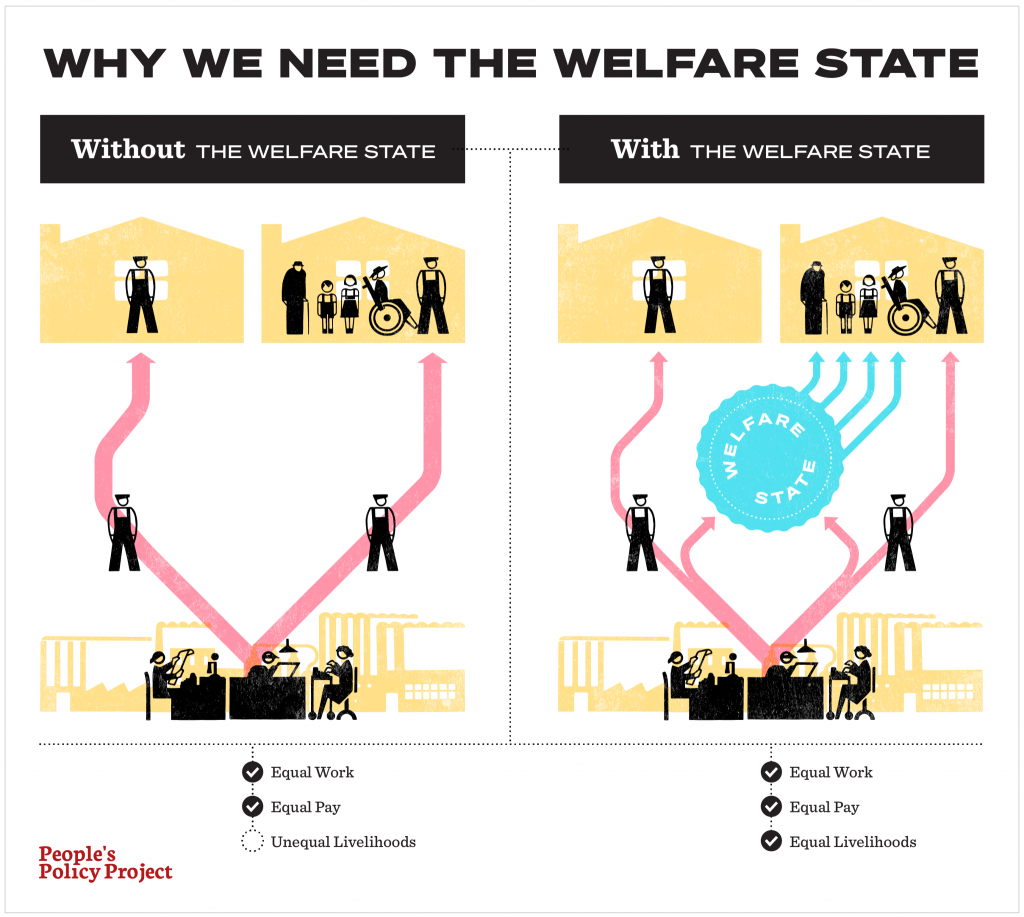
So what we are left with is flipping the first condition and using mechanisms other than payments to laborers and capital owners to distribute the national income. This is called the “welfare state” and it is, as a factual matter, how low-poverty countries come to be that way.
Indeed, if you look at the categories of nonworkers in the graphs above, you might notice that they map perfectly onto the populations that welfare states are designed to serve. In good welfare states:
- Children receive a monthly child benefit check, child care, pre-k, K-12 education, among other things.
- Elderly receive an old-age pension.
- Disabled receive disability benefits.
- Students receive tuition subsidies, living stipends, and subsidized loans.
- Carers receive paid leave and home care allowances.
- Unemployed receive unemployment benefits.
Even the US has some of these benefits and they work in proportion to their coverage and generosity. We can see this in the below graph where I introduce a bar for disposable income poverty, which counts government benefits.
Pushing the black bars lower is just a matter of introducing or increasing benefits for each category. I have written extensively about how exactly to do that (Family Fun Pack, Cleaning Up the Welfare State).
One of the most interesting things about poverty reduction is that you actually don’t need “anti-poverty” policy to achieve it. In fact, the extent to which a society has low poverty seems to be almost inversely related to how much of their welfare state is specifically focused on “the poor” through means-tested benefits. All you really need to do to achieve low poverty is provide benefits universally to all nonworkers without regard to their family income. This approach smooths out inequalities up and down the income ladder by placing the burden of providing for nonworkers on the entire society instead of dumping it unequally on each particular family.
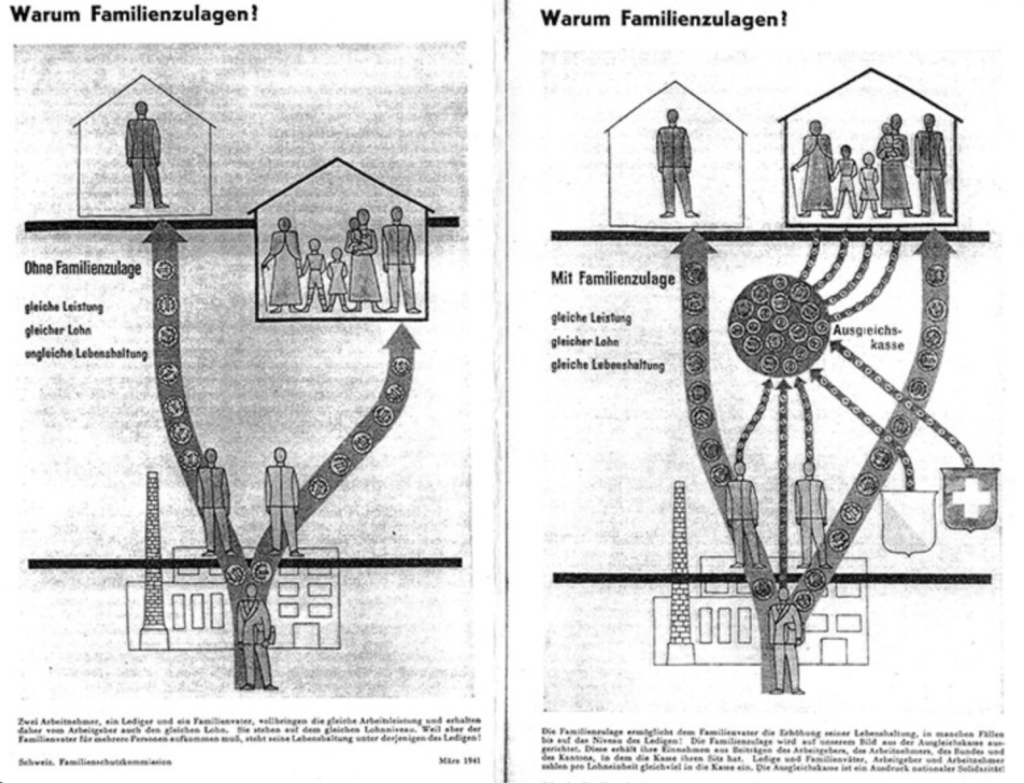
I wish I could say I was the first to come up with this, but I am actually one of the last. In the early 20th century, this was a much more common way of understanding the welfare state. Indeed, everything I’ve written so far was neatly summarized in this 1940s graphic from Switzerland, which we have remade in English below.


It Can Happen to You
To close this out, I think it is important to emphasize that “the poor” are not a static population. It is easy to imagine, as Matt Yglesias does in his recent piece, that poverty afflicts a particular group of people and that those people are different from everyone else:
By contrast, the domestic poor are — unless they are recently arrived immigrants — often people who, for one reason or another, are struggling to get their lives together in a very wealthy country. If they were thrifty and diligent, they wouldn’t be poor in the first place. Putting money in their pockets doesn’t make them thrifty and diligent, so it doesn’t really alter their lives that much.
One way we can see whether this is true is by looking at the extent to which poverty is persistent. The poverty data comes from the Current Population Survey, which has a longitudinal component to it that allows you to track one-fourth of the sample across two consecutive years. By following these people, we can see what percent of people who are poor one year are also poor in the prior or subsequent year.
Using this method, we see that only 41 percent of the 2018 poor were also poor in 2017 under the disposable income poverty metric. Likewise, only 39 percent of the 2018 poor went on to become the 2019 poor. Poverty rates don’t move much year to year, but there is massive churn in and out of the category.
Another interesting thing we can do is look at where the newly poor came from and where the formerly poor wind up. In this next graph, I took everyone in the sample who was poor in 2018 but not poor in 2017 (so newly poor) and then looked to see what income quintile they came from (income quintile here is defined according to income as a percent of the SPM poverty line).
More are coming from the bottom than the top, but still 37 percent of the newly poor came from the middle quintile or above. And this is with just tracking people for a single year.
We can do the same kind of thing for people who were poor in 2018 but not in 2019 and see where they wound up. It shows the same thing.
Where Yglesias goes wrong is quickly handwaving over the idea of “getting their lives together in a wealthy country.” A wealthy country by definition produces a lot of income. But how it chooses to distribute that income — most crucially the degree to which it relies on payments to labor and capital — will decide whether poverty is low. Poverty hits people as they move in and out of different life stages and events. Job loss, disability, divorce, having children, family deaths are things that can and do happen to anyone. And when they do, if the welfare state is not there for them, they will often dip into poverty, at least for a bit.
The other mistake in Yglesias-style thinking is mixing up thrift and diligence with economic success. As with anything else, these traits are distributed throughout all populations, including poor and non-poor populations, which are, in fact, mostly the same people in different years. There are plenty of people who currently have high incomes who nonetheless are not thrifty, not particularly diligent, and have any number of other problems, including addictions to vices, mental health problems, domestic violence, and so on, just as there are plenty of people who currently have low incomes who have none of these problems. It’s just that when we find it in a poor person, we blame their income situation on it, not because one actually follows from the other, but because it makes us feel better about things.
Conclusion
I’ve been doing this long enough to know that, with the exception of certain autistic people, nobody finds the realities of poverty in America as described above very exciting. They really want it to be something more than that, something that you can really sink your teeth into about the fallenness of man or the viciousness of big corporations or whatever. But it really is basically a technical problem in the way that factor payments are misaligned with the distribution of people across households that you can pass a few laws to fix. It is unclear how exactly to get people in the US to go ahead and do that, but it is not unclear what needs to be done.

