
We are proud to announce the publication of our newest paper “Police Killings in the US: Inequalities by Race/Ethnicity and Socioeconomic Position.” The paper was written by Justin Feldman and designed by Jon White.
The databases of police killings contain important demographic information like race, gender, and age. But they do not contain socioeconomic information like education and income. In this paper, Feldman matches 6,451 police killings over the last 5.5 years to the census tract (i.e. neighborhood) where the killing took place. By using the poverty rates of those census tracts, he is able to sort both police killings and populations into five socioeconomic groups ranging from the poorest fifth (poverty rates greater than 23.9 percent) to the least-poor fifth (poverty rates below 5.6 percent).
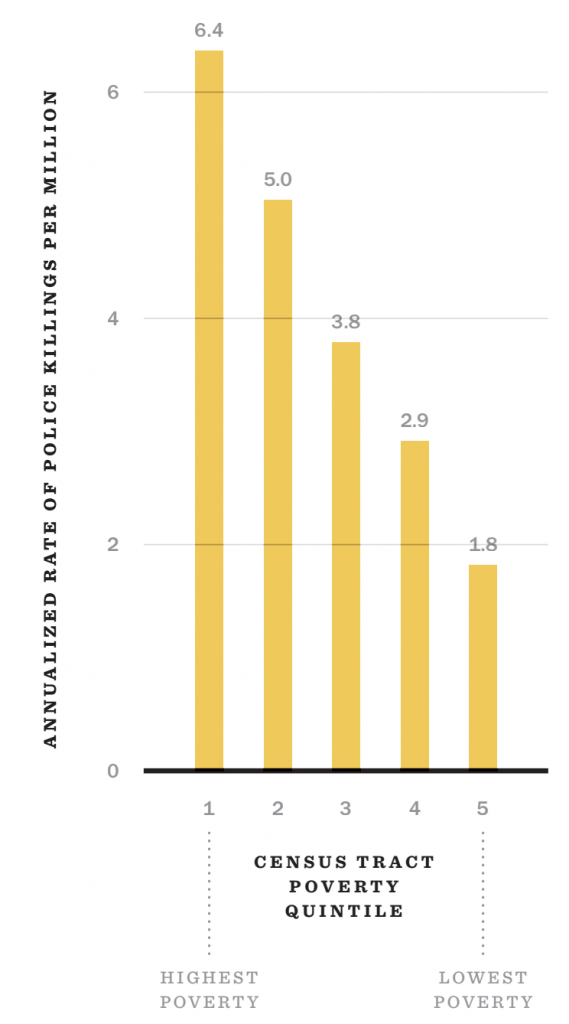
This analysis shows that socioeconomic position plays a big role in police killings. The highest-poverty areas have a police killing rate of 6.4 per million while the lowest-poverty areas have a police killing rate of 1.8 per million, a 3.5-fold difference.
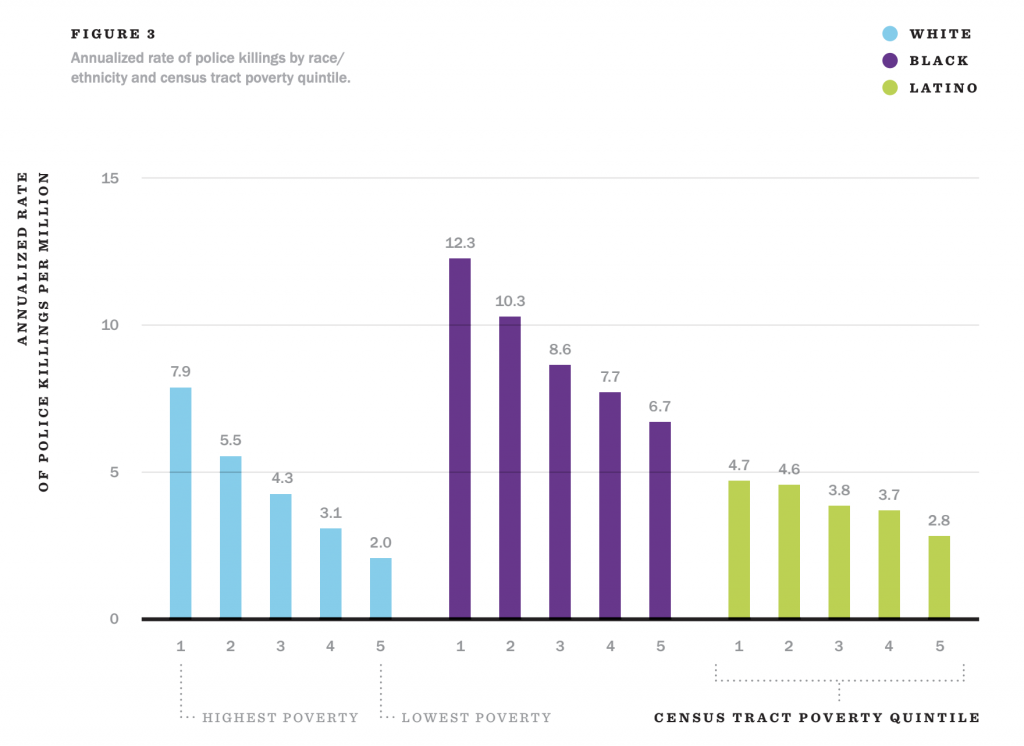
A similar class skew exists within each racial group as well. Whites in the poorest areas have a police killing rate of 7.9 per million, compared to 2 per million for whites in the least-poor areas. Blacks in the poorest areas have a police killing rate of 12.3 per million, compared to 6.7 per million for blacks in the least-poor areas.
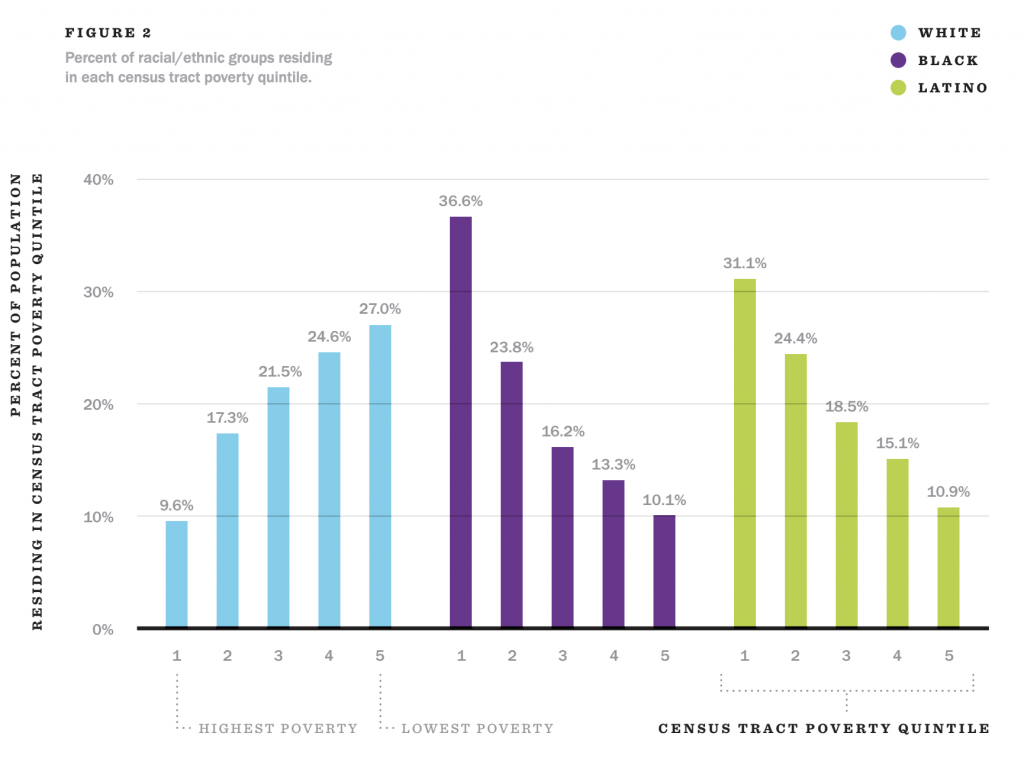
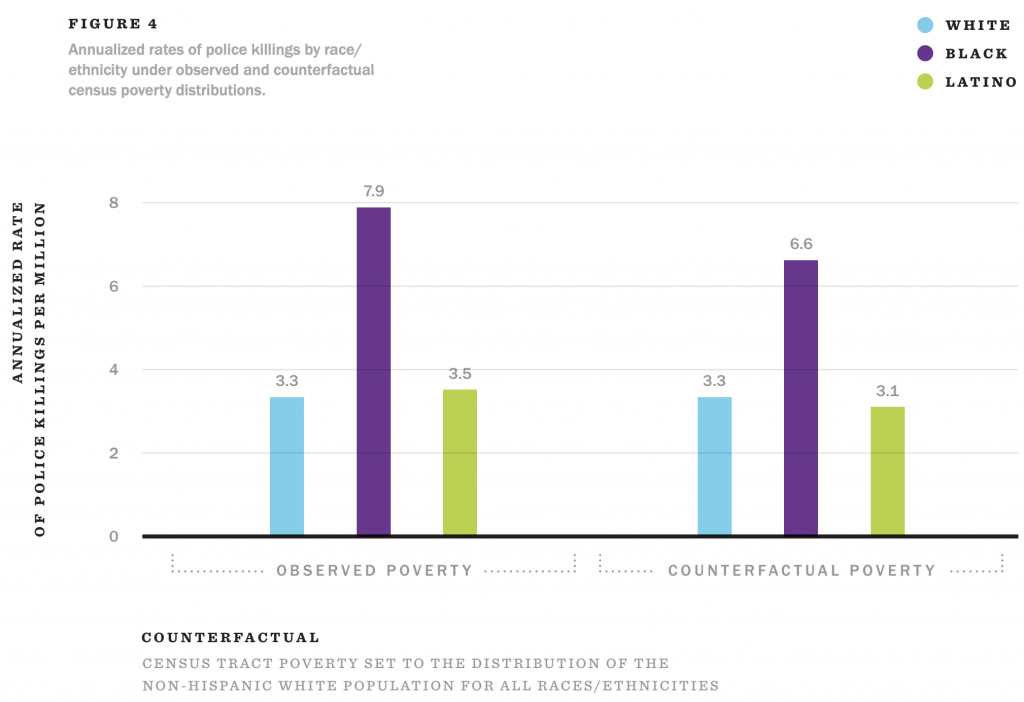
In addition to calculating these police killing rates, Feldman also looked at how individuals in each racial group are distributed across the the five socioeconomic groups. He finds that the homes of blacks and Latinos are more skewed towards the poorest areas while the opposite is true of whites.
By counterfactually redistributing the black and Latino population across the class scale so as to match whites — while holding police killing rates constant — Feldman is able to estimate how much the different socioeconomic positions of the racial groups account for the differences in overall police killing rates.
He finds that class differences account for more than 100 percent of the difference between white and Latino police killing rates, meaning that, after adjusting for socioeconomic differences, Latinos have a lower police killing rate than whites. Class differences account for 28 percent of the difference between black and white police killing rates.
As discussed in the paper, these findings are limited by the data sources available for this kind of analysis. There is no individual-level socioeconomic data and the neighborhood-level data is for the location of the killing, not necessarily for the neighborhood where the decedent lives. On the assumption that there are more poor people killed in rich areas than rich people killed in poor areas, this type of analysis will tend to understate the class disparities.
Overall, Feldman’s research confirms what many already know about criminal justice and specifically police killings in the US. There are large class disparities in police killings, both overall and within each racial group. Likewise, there are large racial disparities in police killings, both overall and within each class group.