

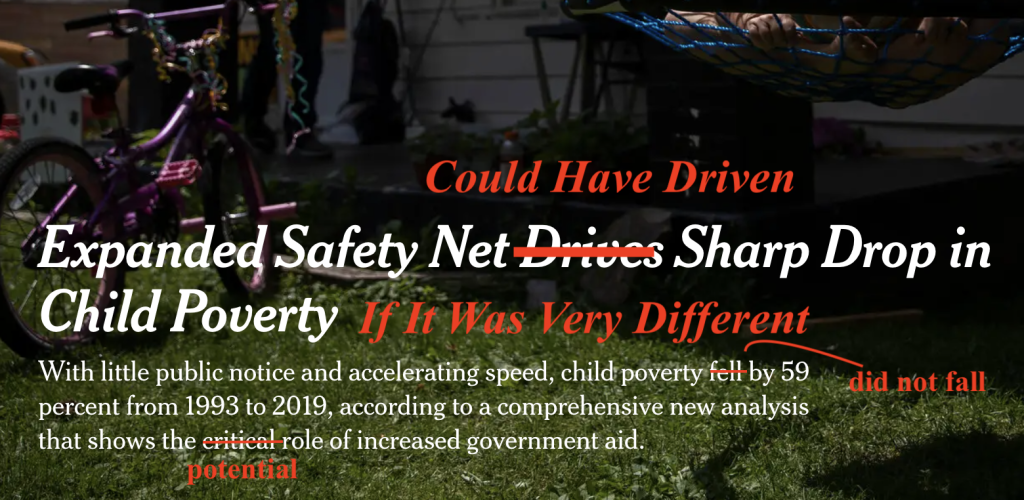
Jason DeParle at the New York Times had a story yesterday about a new study with an apparently surprising conclusion: "child poverty has fallen 59 percent since 1993, with need receding on nearly every front."
The study DeParle discusses in his piece is a seven-author behemoth published at Child Trends. In it, Dana Thomson uses a dataset produced by various Columbia University researchers seven years ago to demonstrate that "the past quarter century witnessed an unprecedented decline in child poverty rates." This bit of introductory text is accompanied by the following graph.

The epic presentation of the study, both by the authors and DeParle, makes it sound like the study contains some kind of groundbreaking information paired with novel methods and insights. But it doesn't really. Anyone can recreate these figures by downloading this spreadsheet linked from the Columbia poverty center website and then, for each year, dividing the number of people age < 18 where SPMu_Resources2 < SPMu_PovThreshold1_cen_Metadj by the number of all people age < 18. The key finding takes about 10 minutes of work.
Other Poverty Metrics
Whenever you see poverty reports like this, especially ones that seem to have a surprising conclusion, you should ask yourself whether something strange is going on with the poverty metric being used and how it compares to other ways of measuring the poverty rate. I hate debating poverty measurements because the whole thing is so arbitrary and the underlying data driving the analysis in the US is so patchy, but when something like this comes out, I have no choice.
In the below graph, I use the same dataset the study authors use, and data from the Luxembourg Income Study and the OECD to plot four different child poverty rates over the last few decades.

The solid orange line is the one the study authors decided to use, with the year 1993 the one they really hone in as the baseline for most of their statistics. To produce this orange line, you first determine what the poverty thresholds were under the Supplemental Poverty Measure (SPM) in 2012. Then, after adjusting for inflation, you use those 2012 poverty thresholds to add up the number of children in poverty for 2012 and every other year. According to this measure, child poverty fell from 27.9 percent in 1993 to 11.4 percent in 2019.
Globally speaking, this is an unusual way to measure poverty. The more typical way of measuring poverty is to determine the median income of the country for a given year (adjusting for family size) and then add up the number of kids with a family income that is below half of the median. In the graph above, the red (LIS Relative), black (OECD relative), and blue (SPM relative) dashed lines use this method. The three lines differ somewhat due to slightly different ways of defining and imputing disposable income and adjusting income for family size, but they largely tell the same story: the child poverty rate declined from around 25 percent in 1993 to around 21 percent in 2019.
EITC and CTC Measurement Problems
The three relative measures graphed above differ considerably from the anchored SPM measure but all four have one important thing in common: they massively overstate the extent to which the Earned Income Tax Credit (EITC) and the Child Tax Credit (CTC) reduce child poverty.
As I discussed in my Myths of the Earned Income Tax Credit paper, the data used to measure the antipoverty effect of the EITC is based on a tax simulation that assumes 100 percent of families receive the benefits that they are eligible for. But the real number is 78 percent.
When you swap out the information produced by the tax simulation with actual IRS data about EITC benefit receipt, as Maggie Jones of the Census and James P. Zilak of the University of Kentucky did in a 2019 study, you find that the tax simulation overstates the overall antipoverty effect of the EITC by 50 percent.
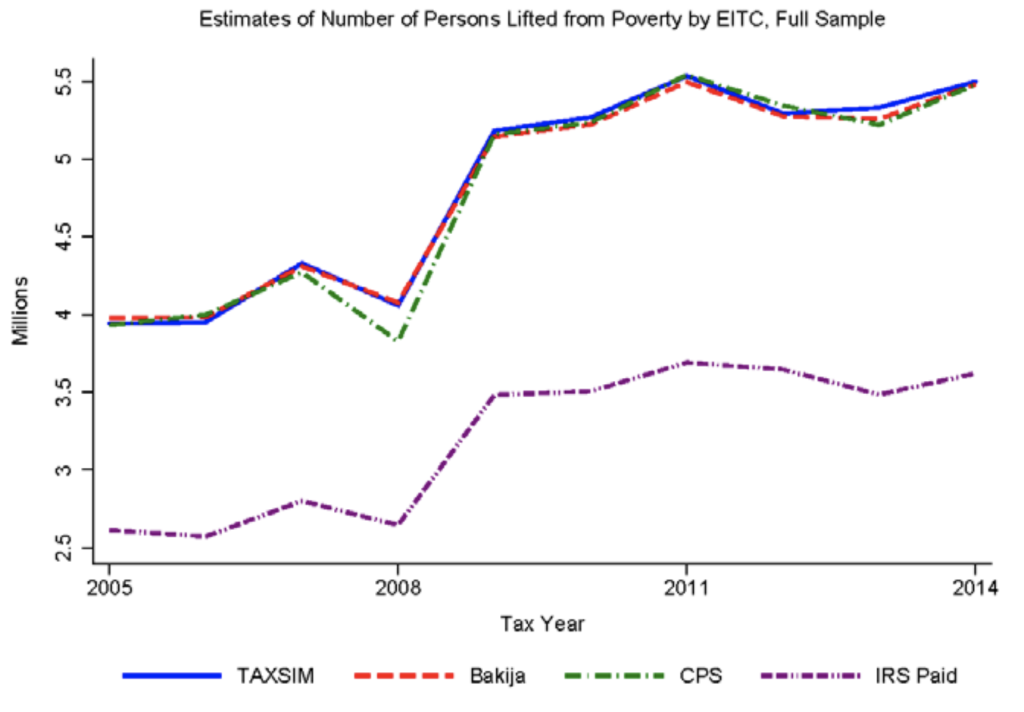
For children specifically, the tax simulation overstates the antipoverty effect of the EITC by around 67 percent.
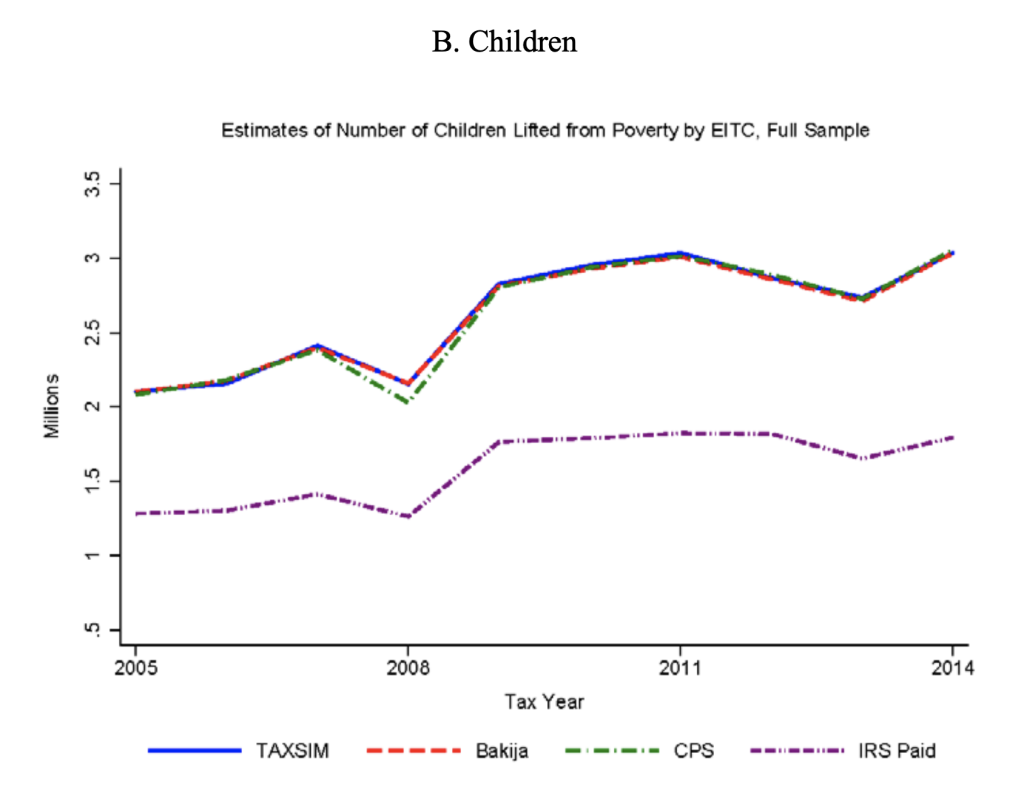
In addition to relying upon an incorrect simulation for EITC and CTC values, the researchers also effectively assume that EITC users receive the full value of the credit they are owed. In reality, 60 percent of EITC beneficiaries use a paid tax preparer to claim their benefits and tax preparers take an average of 13 to 22 percent of the benefit as a preparation fee.
The EITC and CTC benefits used in these poverty measures are also counted in the wrong year. Benefits that families receive from the IRS during tax time of one year are counted as if they were instead received in the prior year. This makes the income-targeting elements of the programs, especially the EITC, appear to be more effective than they actually are. Waiting until the end of the year to see which families had an income just below the poverty line and then giving them money a few months later that you pretend they received in the prior year produces some cool graphs, but it doesn't actually get these children out of poverty in the year that they experienced it.
These points about how the EITC and CTC are measured may seem like nitpicks, but, when it comes to measuring child poverty trends since 1993, they are really important.
The main thing that happened during the 1990s welfare reform and period immediately after it was that cash assistance for the poorest kids (AFDC) was replaced with phased-in tax credits that were targeted at the upper half of poor kids (the CTC and the EITC). Indeed, in the paper's section on the extent to which welfare state expansions have reduced child poverty since 1993, the EITC is doing by far the most work.
But rather than trying to measure how well these tax credits work in reality, these researchers have instead opted to assume it works exactly as the fantasy tax simulators say it does. Deep in the report, they even admit some of these problems with the following disclaimer, which doesn't even include the fact that they are counting tax preparation fees as benefits received and counting the EITC's benefits in the wrong year:
While we highlight the role of the EITC here, our findings regarding the EITC’s role in lifting children out of poverty have important limitations, so we frame our findings as the potential role of the EITC. Our estimates of the role of the EITC are likely overstated, as the EITC values in the Historical SPM Dataset are simulated based on family income, and on family structure and composition. They do not account for whether family members have Social Security numbers, which have, since 1996, been required of all household members in order to receive the EITC—making 21 percent of children in poverty ineligible to receive EITC benefits. The simulated values also do not account for the approximately 20 percent of tax filers who are eligible for, but do not claim, the EITC. Nor does the simulation account for workers who do not routinely file taxes because they have no tax liability, but are nonetheless eligible for, and would receive, the EITC if they were to file taxes.
There is no other word for this presentation than dishonest. The whole report up to this extensive (but still not quite extensive enough) disclaimer makes it sound like the welfare state — or "the safety net" in their idiom — is actually having an effect it is not having. Then they totally back off of this claim in chapter three and say that they just mean that the new welfare state could potentially have this role if it worked very differently from the way it actually works. In his coverage of the paper in the NYT, DeParle certainly did not pick up on this deceptive game.
Once we incorporate the fact that the antipoverty effect of the tax credit regime we now rely upon for child benefits is wildly overstated in the data, it's not clear we've reduced child poverty much at all, certainly not in the relative poverty measures typically used for these kinds of questions.
Using this data to say that "America’s high levels of child poverty" no longer "set it apart from other rich nations," as DeParle does in his piece, is just laughable. Even with the problems identified above, the OECD relative child poverty rate in the US was 21 percent in 2019. By comparison, in 2018, using the exact same measure, Finland's child poverty rate was 3.5 percent and Denmark's was 4.9 percent. This is not convergence.